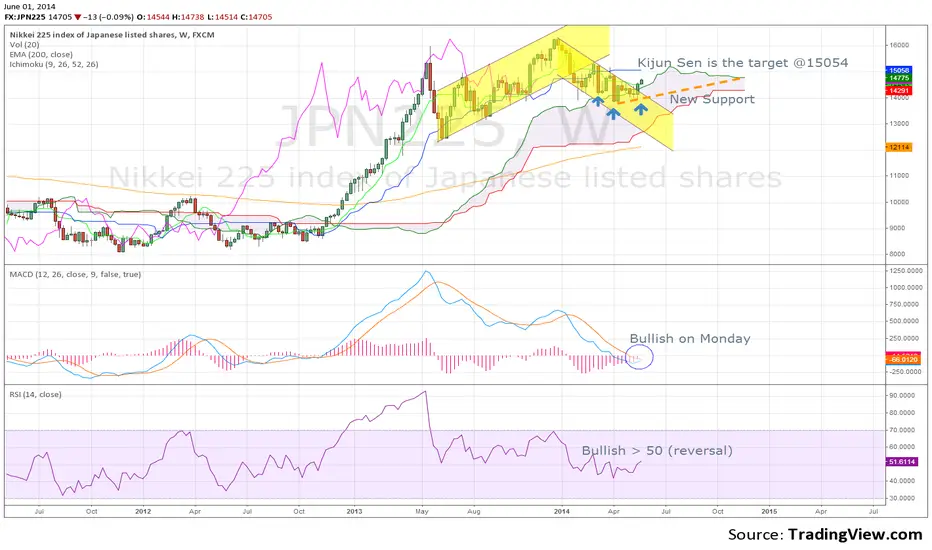
The NIKKEI 225 (JPN225) weekly chart shows the following signs:
Exactly from 6/2013 NIKKEI had been in two channels with different trends. Now it seems to change the trend one more time for upwards. Technically RSI>50 and MACD will be bullish on Monday. Last week the Index with a long candle got over the Tenkan Sen. Next target it seems to be the Kijun Sen at 15054. As you can see in diagram the KUMO offered a strong support to the Index.
I am bullish for NIKKEI except if it returns into the KUMO cloud with a new support line.
Penerbitan berkaitan
Penafian
Maklumat dan penerbitan adalah tidak dimaksudkan untuk menjadi, dan tidak membentuk, nasihat untuk kewangan, pelaburan, perdagangan dan jenis-jenis lain atau cadangan yang dibekalkan atau disahkan oleh TradingView. Baca dengan lebih lanjut di Terma Penggunaan.
Penerbitan berkaitan
Penafian
Maklumat dan penerbitan adalah tidak dimaksudkan untuk menjadi, dan tidak membentuk, nasihat untuk kewangan, pelaburan, perdagangan dan jenis-jenis lain atau cadangan yang dibekalkan atau disahkan oleh TradingView. Baca dengan lebih lanjut di Terma Penggunaan.