🔍Technical Analysis
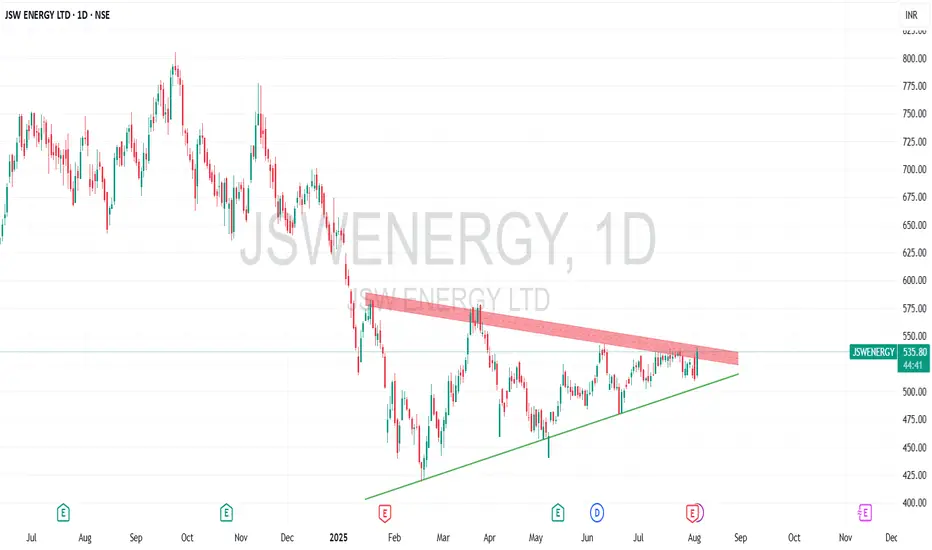
JSW Energy remained range-bound below ₹120–₹130 from 2010–2020, briefly dipping to ₹40 post-COVID. It surged to ₹400 by October 2021, pulled back to ₹200 during the second COVID wave, then rallied past ₹400 in September 2023 and reached ₹800 by September 2024. A crash back to ₹400 followed.
In 2025, the stock formed a symmetrical triangle — a consolidation pattern featuring higher lows and lower highs. Recently, it reported solid Q1 FY26 results, boosting bullish sentiment. A breakout above the triangle signals a fresh move upward.
Entry Strategy: Only enter on a confirmed breakout above the pattern.
Targets:
Target 1: ₹600
Target 2: ₹650
Target 3: ₹700
Stop Losses:
Minor Stop: ₹480 (just below triangle)
Major Stop: ₹400 (strong demand zone)
Breach of these zones would invalidate the bullish thesis.
💰Q1 FY26 Financial Highlights (vs Q4 FY25 & Q1 FY25)
- Total Income: ₹5,143 Cr (↑ +61% QoQ vs ₹3,189 Cr; ↑ +79% YoY vs ₹2,879 Cr)
- Total Expenses: ₹2,355 Cr (↑ +19% QoQ vs ₹1,985 Cr; ↑ +61% YoY vs ₹1,462 Cr)
- Operating Profit: ₹2,789 Cr (↑ +132% QoQ vs ₹1,204 Cr; ↑ +97% YoY vs ₹1,418 Cr)
- Profit Before Tax: ₹1,015 Cr (↑ +181% QoQ vs ₹361 Cr; ↑ +45% YoY vs ₹698 Cr)
- Profit After Tax: ₹836 Cr (↑ +101% QoQ vs ₹415 Cr; ↑ +57% YoY vs ₹534 Cr)
- Diluted EPS: ₹4.25 (↑ +82% QoQ vs ₹2.33; ↑ +42% YoY vs ₹2.99)
🧠Fundamental Highlights
Q1 PAT surged ~102% QoQ and ~57% YoY owing to better generation mix and favorable power tariffs.
Capable of handling ~215 GW of power generation capacity; demand remains stable.
Reported ₹4,833 Cr in cash flows and reduced debt/equity from 1.9× to 1.5×.
Interim dividend declared — ₹0.50/share.
Expansion pipeline includes EV charging infra and solar capacities under JV.
✅Conclusion
JSW Energy shows a clear technical breakout opportunity, backed by robust Q1 results and performance momentum. A confirmed breakout above ₹500 can set the stage toward ₹700. Stay alert to stops at ₹480 and ₹400 to manage risk.
Disclaimer:lnkd.in/gJJDnvn2
Penafian
Maklumat dan penerbitan adalah tidak dimaksudkan untuk menjadi, dan tidak membentuk, nasihat untuk kewangan, pelaburan, perdagangan dan jenis-jenis lain atau cadangan yang dibekalkan atau disahkan oleh TradingView. Baca dengan lebih lanjut di Terma Penggunaan.
Penafian
Maklumat dan penerbitan adalah tidak dimaksudkan untuk menjadi, dan tidak membentuk, nasihat untuk kewangan, pelaburan, perdagangan dan jenis-jenis lain atau cadangan yang dibekalkan atau disahkan oleh TradingView. Baca dengan lebih lanjut di Terma Penggunaan.
