Bullish Scenario:
Entry Signal:
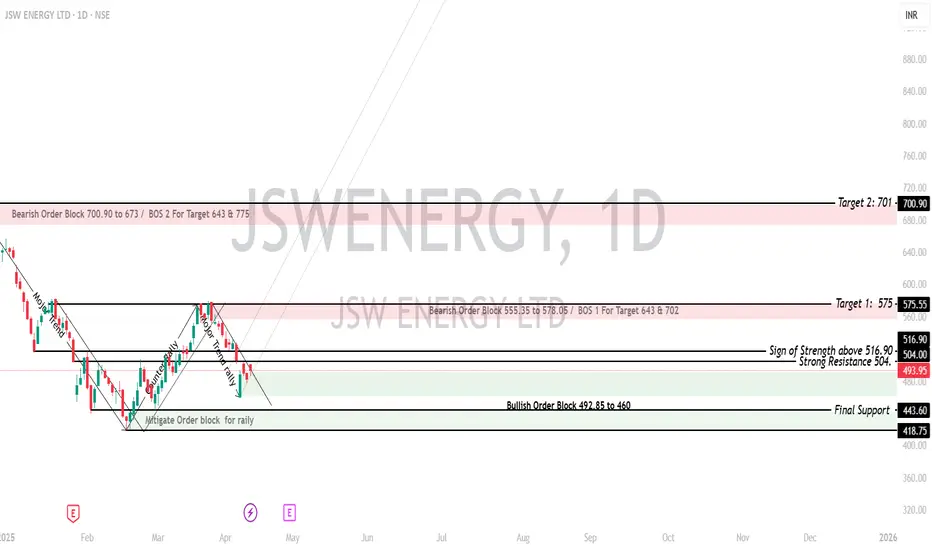
The current market price (CMP) is 482. For a bullish scenario, if the price breaks above the Sign of Strength level at 516.90, it could signal an upward movement.
A break and hold above 516.90 would likely push the price towards Target 1 at 575.55 and then towards Target 2 at 701.00.
Target Levels:
Key Support:
The Strong Resistance at 501.50 may act as an intermediate resistance level to watch for any pullbacks. Once it is cleared, the price could move toward 575.55 and higher.
If the price retraces, Final Support at 418.75 is an important level to hold in order for the bullish trend to remain intact.
Stop-Loss for Bullish Position:
Place a stop-loss below 418.75 (Final Support) to protect against any deeper bearish movement. Alternatively, you could use 501.50 (Strong Resistance) if you prefer a tighter stop.
Bearish Scenario:
Entry Signal:
In a bearish scenario, if the price fails to hold above 482 and shows rejection or consolidation below 516.90, it may signal a potential downward move.
A break below 482 would suggest weakness and the possibility of the price testing the Strong Resistance level at 501.50.
If the price breaks below 418.75 (Final Support), a deeper decline could occur, with potential targets at 400.00 and lower.
Target Levels:
Secondary Target: 400.00 (Final Support). & 380
Key Resistance:
Strong Resistance at 501.50 will be a key level to monitor. If the price fails to rise above this, the bearish outlook will strengthen.
Stop-Loss for Bearish Position:
A stop-loss should be placed above 516.90 (Sign of Strength) or 575.55 (Target 1), as a break above these levels would invalidate the bearish scenario.
Disclaimer:
This analysis is for informational purposes only and does not constitute financial advice. Trading and investing involve substantial risk, and it is important to conduct your own research and seek professional advice before making any investment decisions. The author does not assume any responsibility for any losses incurred as a result of trading or investment activities based on this analysis. Past performance is not indicative of future results.
Entry Signal:
The current market price (CMP) is 482. For a bullish scenario, if the price breaks above the Sign of Strength level at 516.90, it could signal an upward movement.
A break and hold above 516.90 would likely push the price towards Target 1 at 575.55 and then towards Target 2 at 701.00.
Target Levels:
- Target 1: 575.55
- Target 2: 701.00
Key Support:
The Strong Resistance at 501.50 may act as an intermediate resistance level to watch for any pullbacks. Once it is cleared, the price could move toward 575.55 and higher.
If the price retraces, Final Support at 418.75 is an important level to hold in order for the bullish trend to remain intact.
Stop-Loss for Bullish Position:
Place a stop-loss below 418.75 (Final Support) to protect against any deeper bearish movement. Alternatively, you could use 501.50 (Strong Resistance) if you prefer a tighter stop.
Bearish Scenario:
Entry Signal:
In a bearish scenario, if the price fails to hold above 482 and shows rejection or consolidation below 516.90, it may signal a potential downward move.
A break below 482 would suggest weakness and the possibility of the price testing the Strong Resistance level at 501.50.
If the price breaks below 418.75 (Final Support), a deeper decline could occur, with potential targets at 400.00 and lower.
Target Levels:
Secondary Target: 400.00 (Final Support). & 380
Key Resistance:
Strong Resistance at 501.50 will be a key level to monitor. If the price fails to rise above this, the bearish outlook will strengthen.
Stop-Loss for Bearish Position:
A stop-loss should be placed above 516.90 (Sign of Strength) or 575.55 (Target 1), as a break above these levels would invalidate the bearish scenario.
Disclaimer:
This analysis is for informational purposes only and does not constitute financial advice. Trading and investing involve substantial risk, and it is important to conduct your own research and seek professional advice before making any investment decisions. The author does not assume any responsibility for any losses incurred as a result of trading or investment activities based on this analysis. Past performance is not indicative of future results.
Penafian
Maklumat dan penerbitan adalah tidak dimaksudkan untuk menjadi, dan tidak membentuk, nasihat untuk kewangan, pelaburan, perdagangan dan jenis-jenis lain atau cadangan yang dibekalkan atau disahkan oleh TradingView. Baca dengan lebih lanjut di Terma Penggunaan.
Penafian
Maklumat dan penerbitan adalah tidak dimaksudkan untuk menjadi, dan tidak membentuk, nasihat untuk kewangan, pelaburan, perdagangan dan jenis-jenis lain atau cadangan yang dibekalkan atau disahkan oleh TradingView. Baca dengan lebih lanjut di Terma Penggunaan.