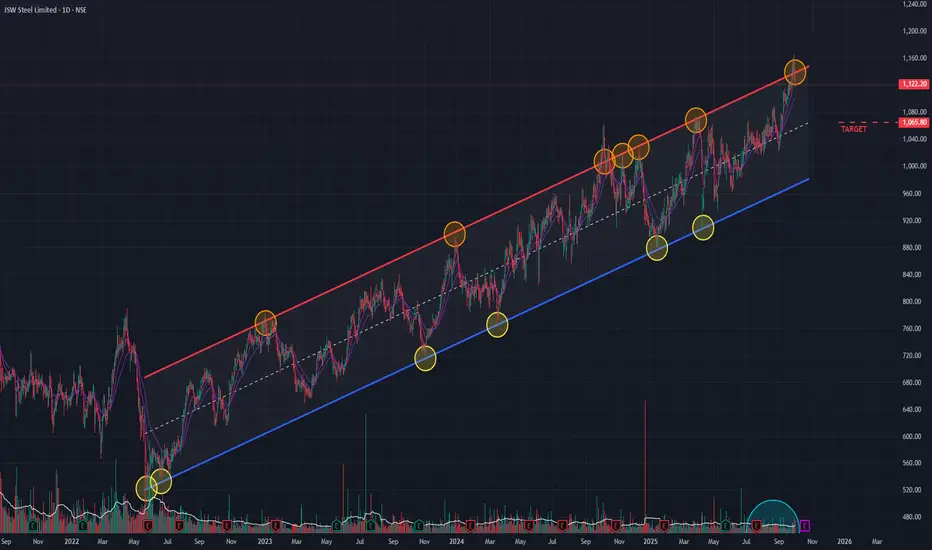
JSW Steel is currently trading at a critical juncture, testing the upper resistance trendline of a well-defined channel pattern that has been in place since May 2022. Historically, this trendline has acted as a strong barrier, often leading to a price reversal back towards the lower end of the channel.
Bearish Indicators Emerge 📉
Several technical indicators are suggesting that the upward momentum is waning and a potential downturn could be imminent:
- RSI Divergence: The Relative Strength Index (RSI) is showing bearish signs on the daily chart and is also starting a negative crossover on the weekly chart.
- Momentum Shift: Short-term Exponential Moving Averages (EMAs) on the daily chart are entering a negative crossover, signaling a potential shift in short-term momentum to the downside.
- Rising Bearish Volume: There has been a noticeable increase in selling volume as the stock approaches this resistance, indicating strengthening bearish pressure.
Outlook and Key Levels
Given the stock's position at a historical resistance level combined with multiple bearish technical signals, a cautious approach is warranted.
If the channel pattern holds true, the stock could reverse from this level and head downwards. A potential downside target in this scenario would be the support level near ₹1,065. The price action in the coming sessions will be crucial to confirm this potential reversal.
Disclaimer: This analysis is my personal view & for educational purposes only. They shall not be construed as trade or investment advice. Before making any financial decision, it is imperative that you consult with a qualified financial professional.
Penafian
Maklumat dan penerbitan adalah tidak dimaksudkan untuk menjadi, dan tidak membentuk, nasihat untuk kewangan, pelaburan, perdagangan dan jenis-jenis lain atau cadangan yang dibekalkan atau disahkan oleh TradingView. Baca dengan lebih lanjut di Terma Penggunaan.