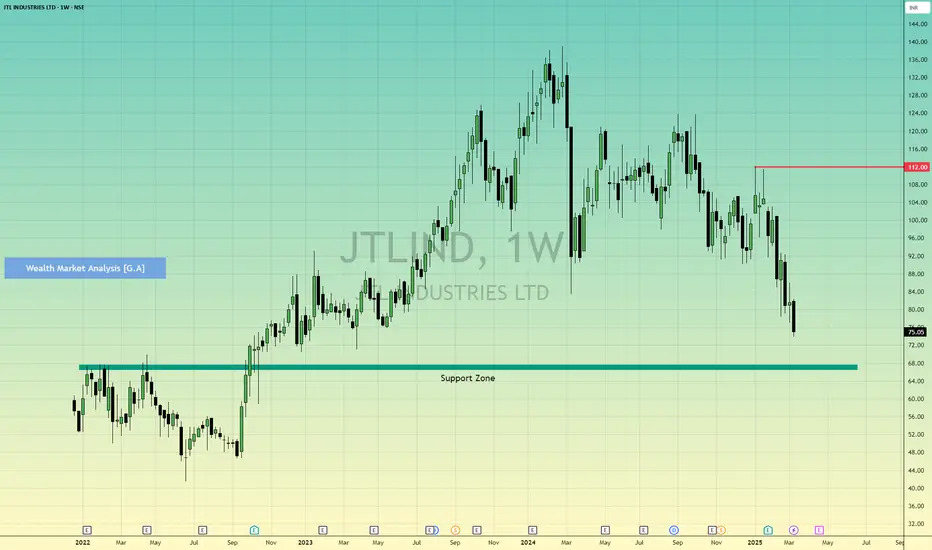
PE 26, ROE 19
In previous chart price didn't close above the level.
✅ JTL Industries Limited, with over 30 years in steel tube manufacturing, produces ERW black steel tubes, galvanized pipes, large-diameter tubes, solar structures, and hollow sections across five facilities in India. The acquisition of Nabha Steel boosts its capabilities.
✅ Total income grew from ₹86 Cr in FY13 to ₹2,039 Cr in FY24, a CAGR of ~33%, with a notable spike from FY21 (₹435 Cr) to FY22 (₹1,355 Cr). TTM at ₹1,912 Cr suggests a slight dip from FY24.
✅ Secured a ₹265 crore order for the Jal Jeevan Mission, expanded Raipur Plant capacity to 200,000 MT/year (50% for value-added products), and is installing Direct Forming Technology (DFT) for enhanced product offerings.
✅ Operating Profit rose from ₹2 Cr (2% OPM) in FY13 to ₹152 Cr (7% OPM) in FY24. PAT increased from ₹1 Cr to ₹113 Cr over the same period, with EPS rising from ₹0.03 to ₹3.28. Margins: OPM stabilized at 7–8% since FY19, peaking at 9% in FY18. TTM OPM remains at 7%, aligning with Q3 FY25’s 7.78% from concall notes.
✅ Dividend payout began in FY21 (11%), dropped to 0% in FY22, and rose to 4% in FY24, indicating a cautious approach to shareholder returns.
Current PE is fair given JTL’s historical range (10–32), industry norms (15–35), and However, the "best" P/E to buy is 22–25.
Happy Investing.
Girish Anchan
W.M.A
Girish Anchan
Penafian
Maklumat dan penerbitan adalah tidak dimaksudkan untuk menjadi, dan tidak membentuk, nasihat untuk kewangan, pelaburan, perdagangan dan jenis-jenis lain atau cadangan yang dibekalkan atau disahkan oleh TradingView. Baca dengan lebih lanjut di Terma Penggunaan.
Girish Anchan
Penafian
Maklumat dan penerbitan adalah tidak dimaksudkan untuk menjadi, dan tidak membentuk, nasihat untuk kewangan, pelaburan, perdagangan dan jenis-jenis lain atau cadangan yang dibekalkan atau disahkan oleh TradingView. Baca dengan lebih lanjut di Terma Penggunaan.
