🟢 Trend Analysis
Current Trend: Bullish
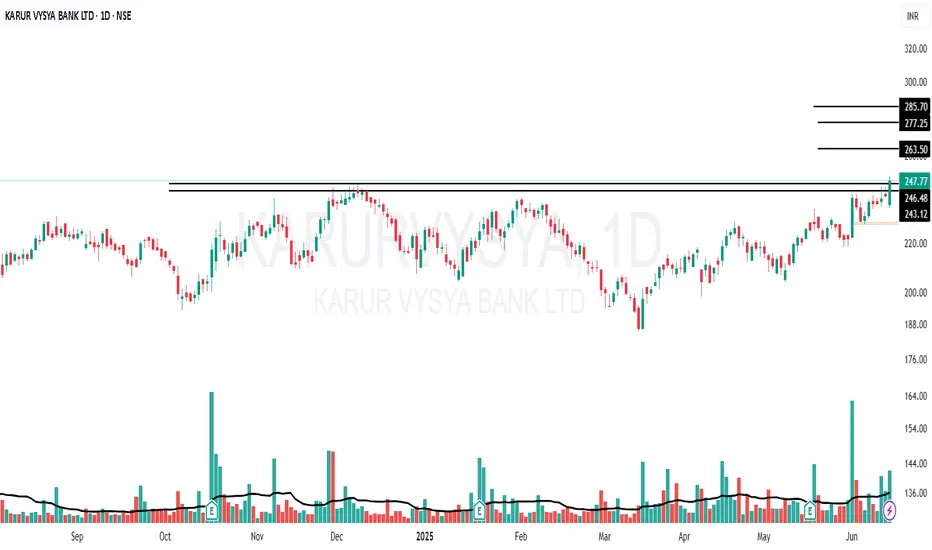
The price has broken out above the previous consolidation/resistance zone (~₹243-246), indicating strength and a potential uptrend continuation.
Higher highs and higher lows structure is visible from April onward.
📊 Chart Pattern
Pattern Observed: Rectangle Base Breakout / Consolidation Breakout
The stock was trading sideways between ~₹220 to ₹245 for a long period.
After multiple attempts, the price finally broke above the range, signaling bullish momentum.
📈 Breakout Level
Breakout Zone: ₹243 – ₹246
Price has closed at ₹247.77, above the resistance zone, confirming a breakout.
Breakout candle is strong with good body size, closing near the day's high.
🔊 Volume Analysis
Volume on breakout: 5.7M (Significantly higher than average volume)
The breakout is supported by strong volume, adding reliability to the move.
Volume spikes on recent green candles suggest strong buyer interest.
🎯 Target Levels
First Target: ₹263
Second Target: ₹277
Third Target: ₹285
🛡️ Stop Loss (SL)
Conservative SL: ₹225.00 (below last swing low)
Penafian
Maklumat dan penerbitan adalah tidak dimaksudkan untuk menjadi, dan tidak membentuk, nasihat untuk kewangan, pelaburan, perdagangan dan jenis-jenis lain atau cadangan yang dibekalkan atau disahkan oleh TradingView. Baca dengan lebih lanjut di Terma Penggunaan.
Penafian
Maklumat dan penerbitan adalah tidak dimaksudkan untuk menjadi, dan tidak membentuk, nasihat untuk kewangan, pelaburan, perdagangan dan jenis-jenis lain atau cadangan yang dibekalkan atau disahkan oleh TradingView. Baca dengan lebih lanjut di Terma Penggunaan.
