Price action and chart pattern trading
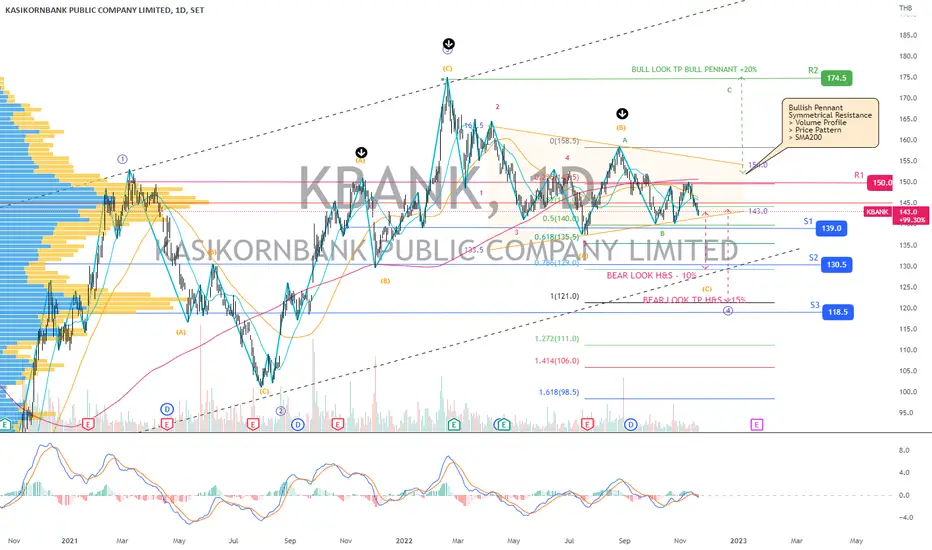
> A 2 conflicting pattern with a bearish move from the larger Head & Shoulders pattern and a bullish one with current bull pennant.
> The larger HS pattern could be overshadowing the smaller pennant pushing the price lower - SMA20 dead crossed SMA50.
> A strong symmetrical resistance; upper volume profile, price resistance, and SMA200.
> This 4-wave diagonal projection is based on the unsuccessful breakout scenario with an upcoming C leg downtrend extension 0.786 - 1.0 approximately - 10 - 15% downside.
> A bullish scenario is based on the successful breakout of bull pennant and SMA200 targeting the previous 3-wave high with a +20% upside.
> Indicator: bearish MACD signal crossing below the signal and baseline
Always trade with affordable risk and respect your stoploss!
Penafian
Maklumat dan penerbitan adalah tidak bertujuan, dan tidak membentuk, nasihat atau cadangan kewangan, pelaburan, dagangan atau jenis lain yang diberikan atau disahkan oleh TradingView. Baca lebih dalam Terma Penggunaan.
Penafian
Maklumat dan penerbitan adalah tidak bertujuan, dan tidak membentuk, nasihat atau cadangan kewangan, pelaburan, dagangan atau jenis lain yang diberikan atau disahkan oleh TradingView. Baca lebih dalam Terma Penggunaan.