📈 KEI INDUSTRIES LTD – Falling Wedge Breakout + AB=CD Bullish Pattern | Daily Chart
🗓️ Date: May 07, 2025
💹 Timeframe: Daily
🏢 Stock: KEI Industries Ltd (NSE)
📊 Chart Analysis Overview:
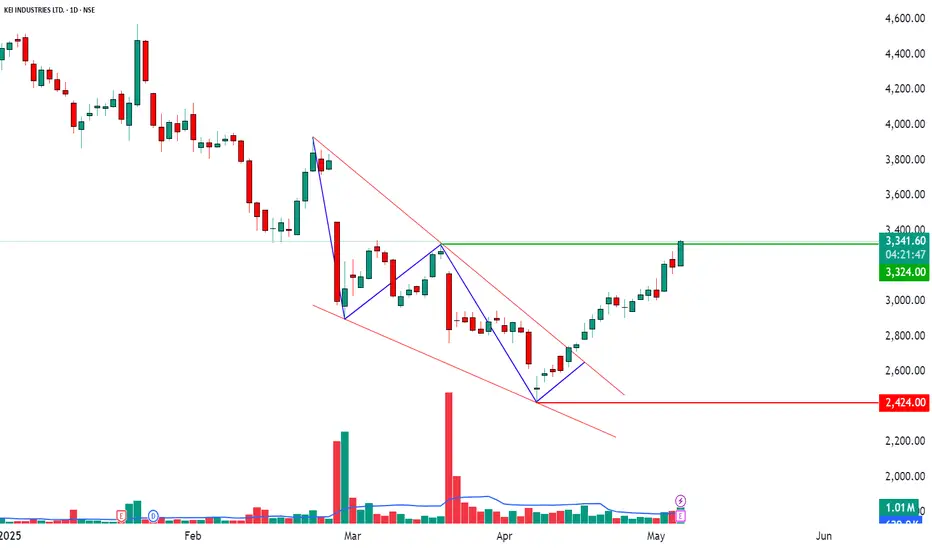
KEI has broken out of a Falling Wedge pattern, a classic bullish continuation/reversal signal, backed by strong volume surge and a completed AB=CD harmonic leg — indicating the bulls are stepping in with conviction.
After weeks of corrective move, the price respected the wedge’s support, formed higher lows, and has now convincingly breached the upper trendline.
🔎 Pattern Breakdown:
✅ Falling Wedge: Identified with red trendlines showing price compression.
✅ AB=CD Harmonic: Blue legs marking symmetrical retracement and projection.
✅ Breakout Confirmation: Bullish candles closing above the wedge resistance with momentum.
📌 Key Technical Levels:
🔴 Support Zone: ₹2,424 (Previous swing low & harmonic completion)
🟢 Resistance Ahead: ₹3,324 (Recent price ceiling)
⚡ CMP: ₹3,318.50
A clean close above ₹3,324 could ignite the next leg of momentum, possibly toward ₹3,500–₹3,650 in coming sessions.
📈 Volume Insight:
Breakout is supported by a noticeable volume expansion — suggesting participation by smart money and institutional interest.
📰 March Quarter Results – Strong Fundamentals:
📈 Consolidated Net Profit:
🟢 ₹226.5 Cr — up 34.5% YoY (vs ₹168.5 Cr last year)
📊 Revenue:
🟢 ₹2,914.8 Cr — up 25.1% YoY (vs ₹2,329.9 Cr)
This earnings momentum adds a fundamental tailwind to the ongoing technical rally.
🧠 Market Bias & Strategy:
As long as the price holds above ₹3,000 and respects the breakout structure, the trend favors bullish momentum traders.
📍 Lookout for a pullback-to-retest near ₹3,200–₹3,250 as a potential entry zone with low-risk, high-reward setup.
🔔 Disclaimer: This analysis is for educational purposes only, not investment advice. Always do your own research or consult your advisor before trading.
🗓️ Date: May 07, 2025
💹 Timeframe: Daily
🏢 Stock: KEI Industries Ltd (NSE)
📊 Chart Analysis Overview:
KEI has broken out of a Falling Wedge pattern, a classic bullish continuation/reversal signal, backed by strong volume surge and a completed AB=CD harmonic leg — indicating the bulls are stepping in with conviction.
After weeks of corrective move, the price respected the wedge’s support, formed higher lows, and has now convincingly breached the upper trendline.
🔎 Pattern Breakdown:
✅ Falling Wedge: Identified with red trendlines showing price compression.
✅ AB=CD Harmonic: Blue legs marking symmetrical retracement and projection.
✅ Breakout Confirmation: Bullish candles closing above the wedge resistance with momentum.
📌 Key Technical Levels:
🔴 Support Zone: ₹2,424 (Previous swing low & harmonic completion)
🟢 Resistance Ahead: ₹3,324 (Recent price ceiling)
⚡ CMP: ₹3,318.50
A clean close above ₹3,324 could ignite the next leg of momentum, possibly toward ₹3,500–₹3,650 in coming sessions.
📈 Volume Insight:
Breakout is supported by a noticeable volume expansion — suggesting participation by smart money and institutional interest.
📰 March Quarter Results – Strong Fundamentals:
📈 Consolidated Net Profit:
🟢 ₹226.5 Cr — up 34.5% YoY (vs ₹168.5 Cr last year)
📊 Revenue:
🟢 ₹2,914.8 Cr — up 25.1% YoY (vs ₹2,329.9 Cr)
This earnings momentum adds a fundamental tailwind to the ongoing technical rally.
🧠 Market Bias & Strategy:
As long as the price holds above ₹3,000 and respects the breakout structure, the trend favors bullish momentum traders.
📍 Lookout for a pullback-to-retest near ₹3,200–₹3,250 as a potential entry zone with low-risk, high-reward setup.
🔔 Disclaimer: This analysis is for educational purposes only, not investment advice. Always do your own research or consult your advisor before trading.
STWP | Mentor & Demand-Supply Specialist | Empowering traders through structured learning |
simpletradewithpatience.com
Community: chat.whatsapp.com/BEYz0tkqP0fJPBCWf59uel
wa.me/message/6IOPHGOXMGZ4N1
Educational Only
simpletradewithpatience.com
Community: chat.whatsapp.com/BEYz0tkqP0fJPBCWf59uel
wa.me/message/6IOPHGOXMGZ4N1
Educational Only
Penafian
Maklumat dan penerbitan adalah tidak bertujuan, dan tidak membentuk, nasihat atau cadangan kewangan, pelaburan, dagangan atau jenis lain yang diberikan atau disahkan oleh TradingView. Baca lebih dalam Terma Penggunaan.