Panjang
$KRA 4 Month Continuation #HeadandShoulders #ChartPattern
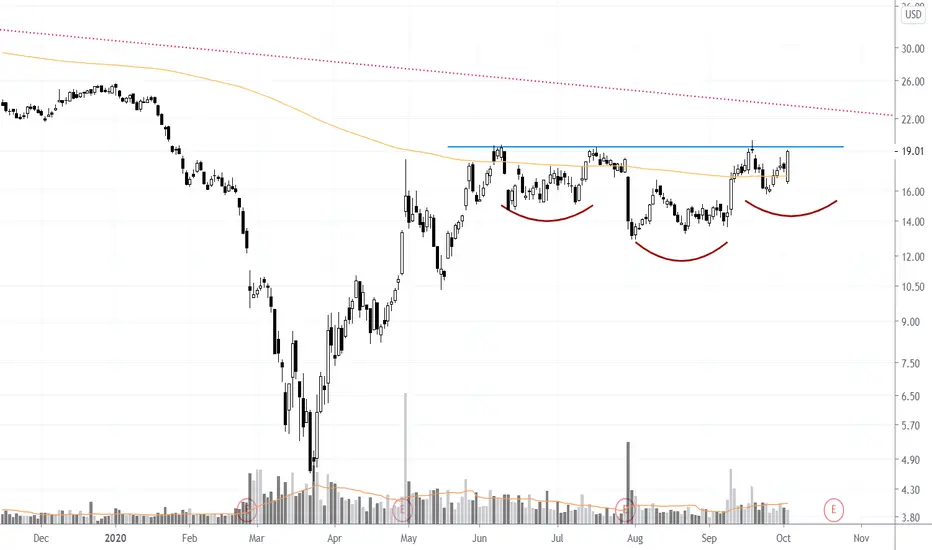
KKRA been consolidating around the 200 MA for the last 4 months forming a nice continuation head and shoulders chart pattern. The stock tested the $19.50 price level multiple times and closed right below it on Friday. If you buy a clear close above chart pattern boundary resistance, watch for the down slopping weekly trend line (red line on the chart) as the stock could hesitate or reverse at around $23.
Nota
hitting weekly down sloping resistance. nice breakout and follow through✔ Momentum & Breakout Trader Since 2006 | Influenced by Mark Minervini VCP Trading Style & William O'Neil CANSLIM 📈
✔ Follow me on Twitter @taplot - twitter.com/TaPlot
✔ YouTube channel youtube.com/@taplot
✔ Follow me on Twitter @taplot - twitter.com/TaPlot
✔ YouTube channel youtube.com/@taplot
Penafian
Maklumat dan penerbitan adalah tidak bertujuan, dan tidak membentuk, nasihat atau cadangan kewangan, pelaburan, dagangan atau jenis lain yang diberikan atau disahkan oleh TradingView. Baca lebih dalam Terma Penggunaan.
✔ Momentum & Breakout Trader Since 2006 | Influenced by Mark Minervini VCP Trading Style & William O'Neil CANSLIM 📈
✔ Follow me on Twitter @taplot - twitter.com/TaPlot
✔ YouTube channel youtube.com/@taplot
✔ Follow me on Twitter @taplot - twitter.com/TaPlot
✔ YouTube channel youtube.com/@taplot
Penafian
Maklumat dan penerbitan adalah tidak bertujuan, dan tidak membentuk, nasihat atau cadangan kewangan, pelaburan, dagangan atau jenis lain yang diberikan atau disahkan oleh TradingView. Baca lebih dalam Terma Penggunaan.