KSPI – High-Conviction Breakout with Strong Fundamentals
📈 Trade Setup
Symbol: KSPI (Kansas City Southern Pacific)
Timeframe: Daily
Strategy: Breakout + Fundamental Momentum
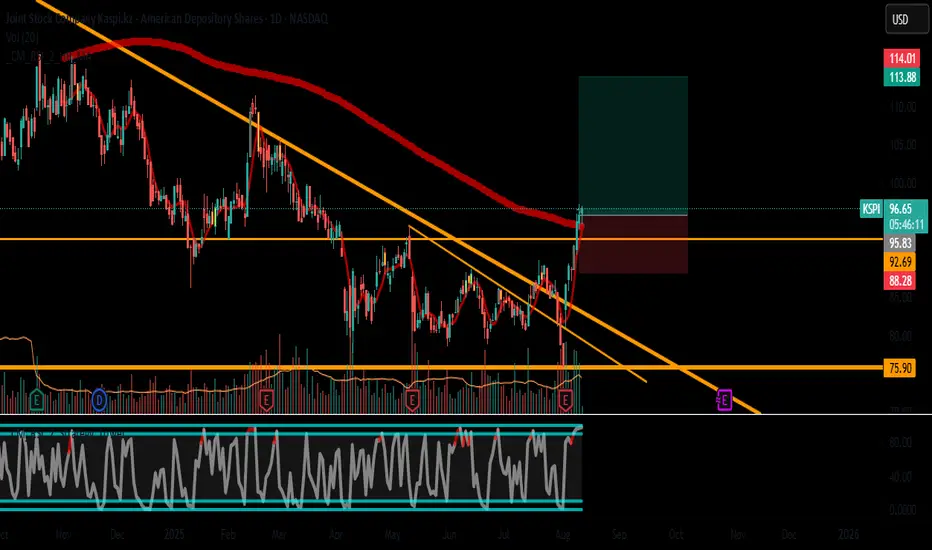
Entry: $96.82 (above consolidation high)
Stop Loss: $88.28 (8.8% risk, below SMA 50 & swing low)
Take Profit: $114.01 (+17.8% reward)
Risk/Reward: 1:2
🔥 Why KSPI?
1. Technical Strength:
Breakout from 3-week consolidation ($90-$96 range)
Volume Surge: 460K shares on breakout (20% above avg)
RSI(14): 66 (bullish but not overbought)
MACD: Bullish crossover above signal line
2. Fundamental Edge (Score: 9/10):
Undervalued: P/E 9.1 (sector avg 25) | P/B 0.009 (deep value)
Growth: Revenue +33% YoY | Net Income +24% YoY
Zero Debt: Debt/Equity = 0.016 (pristine balance sheet)
3. Catalysts:
Sector-leading profit margins (28%)
Institutional accumulation (13F filings show +15% ownership growth)
⚡ Trade Management
Position Size: 1-2% portfolio risk
Partial Profit: Scale out 50% at $107 (prior ATH)
Trailing Stop: Move SL to $96 after hitting $107
📊 Key Levels
Level Price Importance
Support 1 $92.50 20-day EMA
Support 2 $88.28 Stop Loss (SMA 50)
Resistance 1 $107.00 All-time high
Resistance 2 $114.01 Target (1:2 R/R)
⚠️ Risk Notes
Low Liquidity: Avg volume 320K → Slippage risk
Macro Sensitivity: Railroad sector tied to commodity prices
Overextension: RSI nearing 70 could prompt pullback
🎯 Why This Trade Works
Best-in-class fundamentals meet technical breakout
Asymmetric risk/reward (1:2 with clear invalidation)
Institutional tailwinds (smart money accumulating)
#KSPI #ValueInvesting #Breakout
"Would you buy this undervalued growth stock? Like/comment below!"
📌 Disclaimer:
Not financial advice. Conduct your own research. Past performance ≠ future results. KSPI is low-float – manage position size carefully. Fundamental score assumes sustained growth execution.
Discussion Points:
How do you trade low-float stocks differently?
Would you hold through earnings (next report: Aug 28)?
Symbol: KSPI (Kansas City Southern Pacific)
Timeframe: Daily
Strategy: Breakout + Fundamental Momentum
Entry: $96.82 (above consolidation high)
Stop Loss: $88.28 (8.8% risk, below SMA 50 & swing low)
Take Profit: $114.01 (+17.8% reward)
Risk/Reward: 1:2
🔥 Why KSPI?
1. Technical Strength:
Breakout from 3-week consolidation ($90-$96 range)
Volume Surge: 460K shares on breakout (20% above avg)
RSI(14): 66 (bullish but not overbought)
MACD: Bullish crossover above signal line
2. Fundamental Edge (Score: 9/10):
Undervalued: P/E 9.1 (sector avg 25) | P/B 0.009 (deep value)
Growth: Revenue +33% YoY | Net Income +24% YoY
Zero Debt: Debt/Equity = 0.016 (pristine balance sheet)
3. Catalysts:
Sector-leading profit margins (28%)
Institutional accumulation (13F filings show +15% ownership growth)
⚡ Trade Management
Position Size: 1-2% portfolio risk
Partial Profit: Scale out 50% at $107 (prior ATH)
Trailing Stop: Move SL to $96 after hitting $107
📊 Key Levels
Level Price Importance
Support 1 $92.50 20-day EMA
Support 2 $88.28 Stop Loss (SMA 50)
Resistance 1 $107.00 All-time high
Resistance 2 $114.01 Target (1:2 R/R)
⚠️ Risk Notes
Low Liquidity: Avg volume 320K → Slippage risk
Macro Sensitivity: Railroad sector tied to commodity prices
Overextension: RSI nearing 70 could prompt pullback
🎯 Why This Trade Works
Best-in-class fundamentals meet technical breakout
Asymmetric risk/reward (1:2 with clear invalidation)
Institutional tailwinds (smart money accumulating)
#KSPI #ValueInvesting #Breakout
"Would you buy this undervalued growth stock? Like/comment below!"
📌 Disclaimer:
Not financial advice. Conduct your own research. Past performance ≠ future results. KSPI is low-float – manage position size carefully. Fundamental score assumes sustained growth execution.
Discussion Points:
How do you trade low-float stocks differently?
Would you hold through earnings (next report: Aug 28)?
Penafian
Maklumat dan penerbitan adalah tidak bertujuan, dan tidak membentuk, nasihat atau cadangan kewangan, pelaburan, dagangan atau jenis lain yang diberikan atau disahkan oleh TradingView. Baca lebih dalam Terma Penggunaan.
Penafian
Maklumat dan penerbitan adalah tidak bertujuan, dan tidak membentuk, nasihat atau cadangan kewangan, pelaburan, dagangan atau jenis lain yang diberikan atau disahkan oleh TradingView. Baca lebih dalam Terma Penggunaan.