Technical Analysis
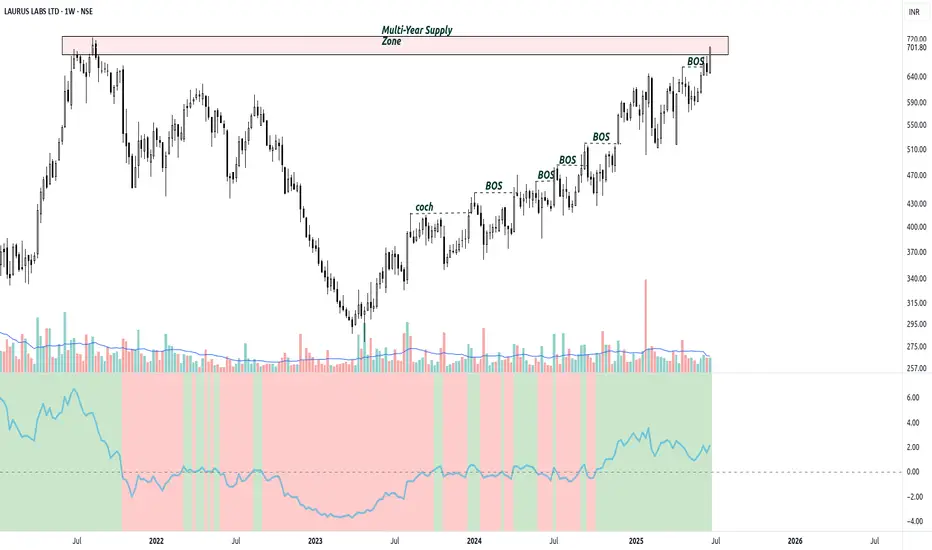
✅ 1. Price Structure: Higher Highs, Higher Lows
📊 2. Multi-Year Base Breakout Setup
📈 3. Relative Strength (RS) vs Nifty
📉 4. Moving Averages: Strong Alignment
🔊 5. Volume Analysis
🧠 Summary and Trade Plan
▶️ Bullish Case:
⛔ Bearish Risk:
🎯 Entry Watch:
🧭 Final Thoughts
✅ 1. Price Structure: Higher Highs, Higher Lows
- The chart shows strong base-building over nearly 2 years following the explosive rally in 2020.
- Price formed a consolidation zone between ₹430–₹640, absorbing previous supply.
- Recent candles show tight price action and multiple Break of Structure (BOS) events — a classic signature of institutional accumulation.
- It is now approaching the all-time high zone (~₹720), acting as a key breakout level.
📊 2. Multi-Year Base Breakout Setup
- The current price action forms an ascending base, which often precedes explosive continuation in trending stocks.
- The price has moved up in tight bands with shallow corrections, reflecting volatility contraction — another bullish pattern.
- If price decisively breaks above ₹720 with volume, it could trigger a long-term uptrend continuation.
📈 3. Relative Strength (RS) vs Nifty
- The RS line has finally turned positive after a prolonged underperformance (2022–2023).
- Sustained RS strength on a weekly chart signals potential leadership behavior.
- The stock is now outperforming the benchmark, which is a critical filter in breakout selection.
📉 4. Moving Averages: Strong Alignment
- All major EMAs (20, 50, 100, 200 weekly) are now curved upward, showing a healthy trending environment.
- Price is comfortably trading above all EMAs, acting as dynamic support and confirming trend strength.
- 50-week EMA recently crossed above the 200-week EMA — a bullish long-term signal (Golden Cross on weekly).
🔊 5. Volume Analysis
- Volume is slightly muted but stable and consistent, indicating quiet accumulation.
- A breakout candle with a volume surge above the historical average would be ideal confirmation.
- The lack of wide-range down bars suggests distribution is absent.
🧠 Summary and Trade Plan
▶️ Bullish Case:
- Break and close above ₹720 on strong volume can activate a long-term trend continuation.
- Potential for a measured move of ~₹200–₹250, taking the stock toward ₹900–₹950 over time, if momentum sustains.
⛔ Bearish Risk:
- A rejection from ₹720 without follow-through, especially with increasing volume, may result in range re-entry.
- Invalidated if stock closes below ₹630–640 on the weekly chart.
🎯 Entry Watch:
- Ideal entry: Breakout + retest of ₹720 with narrowing candles.
- Aggressive entry: Around CMP with stop-loss below ₹630 and trail the stop as it trends.
🧭 Final Thoughts
- Laurus Labs is showing a mature base with breakout-ready structure. The trend strength, relative performance, and BOS stack-up make it one of the cleaner charts among mid-cap pharma names.
- All eyes should be on price action and volume near the ₹720 zone — this is where smart money often tips its hand.
Penafian
Maklumat dan penerbitan adalah tidak dimaksudkan untuk menjadi, dan tidak membentuk, nasihat untuk kewangan, pelaburan, perdagangan dan jenis-jenis lain atau cadangan yang dibekalkan atau disahkan oleh TradingView. Baca dengan lebih lanjut di Terma Penggunaan.
Penafian
Maklumat dan penerbitan adalah tidak dimaksudkan untuk menjadi, dan tidak membentuk, nasihat untuk kewangan, pelaburan, perdagangan dan jenis-jenis lain atau cadangan yang dibekalkan atau disahkan oleh TradingView. Baca dengan lebih lanjut di Terma Penggunaan.