The Elliott Wave Theory's description of the structure and pattern of price movements in financial markets is known as the Elliott Wave Structure.
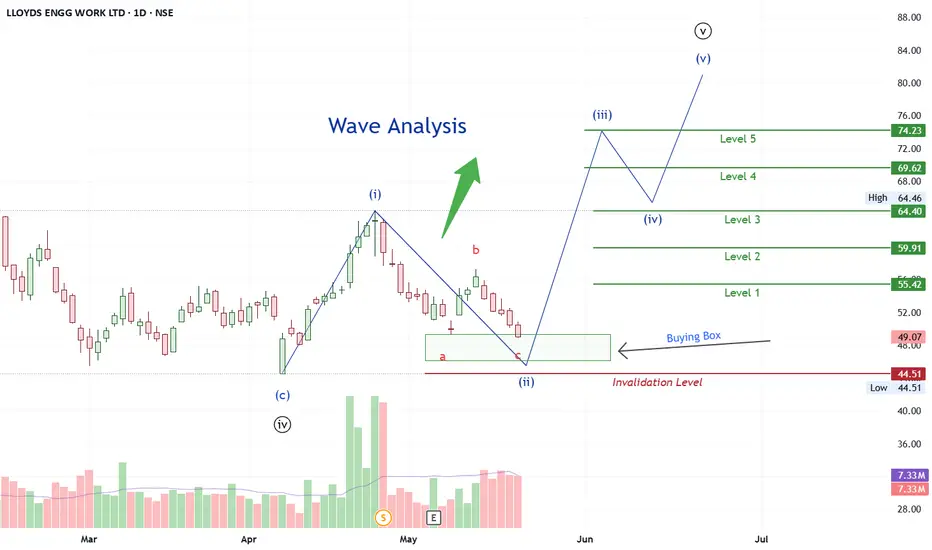
The Elliott Wave analysis indicates that the stock has completed waves (i),(ii),(iii) and (iv), which are shown as black circle numbers on the daily chart. Wave (v) appears to be underway at this time.
Wave (v) in black circle, also known as the impulse wave, unfolding into five waves, which are illustrated in blue colour.
Wave (i) in blue colour is finished.
wave (ii) i.e. corrective wave unfolding in a-b-c pattern. wave (ii) is about to finish.
Buy on dip.
wave (iii) in blue colour will start after the completion of wave (ii).
The double Bottom pattern is forming i.e. a bullish reversal pattern.
 (The double Bottom pattern is a bullish reversal pattern)
The falling wedge pattern is also forming on the chart i.e. a bullish reversal pattern
 (The falling wedge is a bullish reversal pattern)
Wave levels are depicted on the chart.
Level of Invalidation
The invalidation level of 44.51 has been identified as the start point of wave (i). If the price falls below this level, it means that the projected Elliott Wave pattern is not as it appears.
I'm not a registered Sebi analyst. My research is done solely for academic purposes.
Please consult your financial advisor before trading or investing. I bear no responsibility for your profits or losses.
Regards,
Dr Vineet
The Elliott Wave analysis indicates that the stock has completed waves (i),(ii),(iii) and (iv), which are shown as black circle numbers on the daily chart. Wave (v) appears to be underway at this time.
Wave (v) in black circle, also known as the impulse wave, unfolding into five waves, which are illustrated in blue colour.
Wave (i) in blue colour is finished.
wave (ii) i.e. corrective wave unfolding in a-b-c pattern. wave (ii) is about to finish.
Buy on dip.
wave (iii) in blue colour will start after the completion of wave (ii).
The double Bottom pattern is forming i.e. a bullish reversal pattern.
The falling wedge pattern is also forming on the chart i.e. a bullish reversal pattern
Wave levels are depicted on the chart.
Level of Invalidation
The invalidation level of 44.51 has been identified as the start point of wave (i). If the price falls below this level, it means that the projected Elliott Wave pattern is not as it appears.
I'm not a registered Sebi analyst. My research is done solely for academic purposes.
Please consult your financial advisor before trading or investing. I bear no responsibility for your profits or losses.
Regards,
Dr Vineet
Dagangan aktif
Level 1 achieved.Nota
Level 2 achievedDagangan ditutup: sasaran tercapai
Target reached.Penafian
Maklumat dan penerbitan adalah tidak bertujuan, dan tidak membentuk, nasihat atau cadangan kewangan, pelaburan, dagangan atau jenis lain yang diberikan atau disahkan oleh TradingView. Baca lebih dalam Terma Penggunaan.
Penafian
Maklumat dan penerbitan adalah tidak bertujuan, dan tidak membentuk, nasihat atau cadangan kewangan, pelaburan, dagangan atau jenis lain yang diberikan atau disahkan oleh TradingView. Baca lebih dalam Terma Penggunaan.