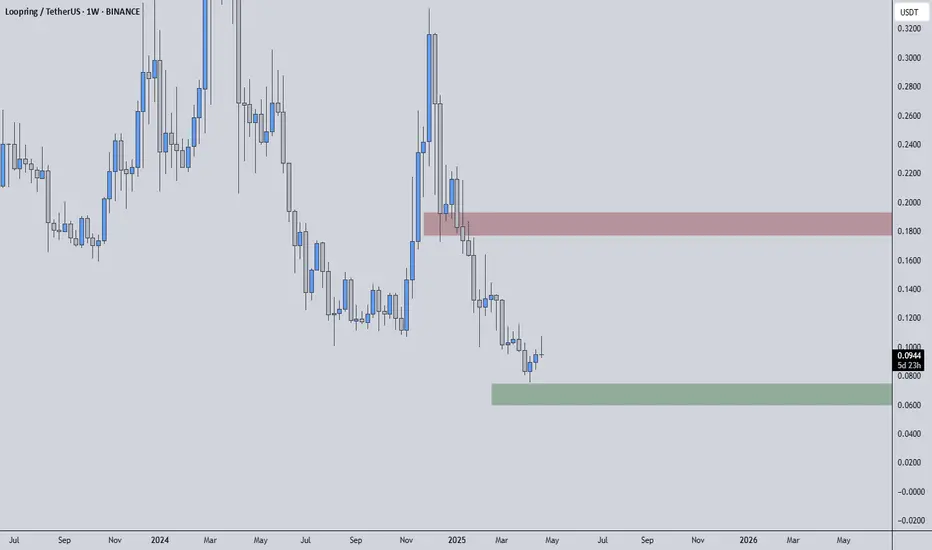
LRCUSDT is trading between clearly defined zones, where the red box acts as a significant resistance and the green box serves as a mild support level. However, the critical detail here is that the support does not appear very reliable — and that should make you extra cautious if you're planning to long from there.
🔴 Resistance: Respect the Sellers
The red box is a zone where sellers have previously stepped in and where supply could easily overwhelm demand again. If price approaches this region and starts to struggle, short opportunities can be considered — but only with confirmation on lower time frames. Think exhaustion candles, failed breakouts, and lack of volume follow-through.
🟢 Support: Don’t Get Too Comfortable
Yes, the green box might offer a small reaction zone, but this isn’t the kind of support you marry — it’s the kind you date briefly. If the price drops and finds temporary footing there, scalps or short-term longs might work, but you should not be expecting major reversals unless significant volume and structure change show up.
🧠 Mental Model:
If price hits the green box and breaks below, don’t hold on hoping for a miracle. Let go fast.
If price reaches the red box and confirms rejection, lean into the short with a tight stop.
If the red box breaks and holds above, especially with volume and bullish orderflow, that’s your cue to flip the bias and ride the move higher with a new mindset.
Remember, trading is a game of adaptation, not ego. Stick to structure, wait for your confirmations, and stay emotion-free in your decisions.
📌I keep my charts clean and simple because I believe clarity leads to better decisions.
📌My approach is built on years of experience and a solid track record. I don’t claim to know it all but I’m confident in my ability to spot high-probability setups.
📌If you would like to learn how to use the heatmap, cumulative volume delta and volume footprint techniques that I use below to determine very accurate demand regions, you can send me a private message. I help anyone who wants it completely free of charge.
🔑I have a long list of my proven technique below:
I stopped adding to the list because it's kinda tiring to add 5-10 charts in every move but you can check my profile and see that it goes on..
🔴 Resistance: Respect the Sellers
The red box is a zone where sellers have previously stepped in and where supply could easily overwhelm demand again. If price approaches this region and starts to struggle, short opportunities can be considered — but only with confirmation on lower time frames. Think exhaustion candles, failed breakouts, and lack of volume follow-through.
🟢 Support: Don’t Get Too Comfortable
Yes, the green box might offer a small reaction zone, but this isn’t the kind of support you marry — it’s the kind you date briefly. If the price drops and finds temporary footing there, scalps or short-term longs might work, but you should not be expecting major reversals unless significant volume and structure change show up.
🧠 Mental Model:
If price hits the green box and breaks below, don’t hold on hoping for a miracle. Let go fast.
If price reaches the red box and confirms rejection, lean into the short with a tight stop.
If the red box breaks and holds above, especially with volume and bullish orderflow, that’s your cue to flip the bias and ride the move higher with a new mindset.
Remember, trading is a game of adaptation, not ego. Stick to structure, wait for your confirmations, and stay emotion-free in your decisions.
📌I keep my charts clean and simple because I believe clarity leads to better decisions.
📌My approach is built on years of experience and a solid track record. I don’t claim to know it all but I’m confident in my ability to spot high-probability setups.
📌If you would like to learn how to use the heatmap, cumulative volume delta and volume footprint techniques that I use below to determine very accurate demand regions, you can send me a private message. I help anyone who wants it completely free of charge.
🔑I have a long list of my proven technique below:
- 🎯 ZENUSDT.P: Patience & Profitability | %230 Reaction from the Sniper Entry
- 🐶 DOGEUSDT.P: Next Move
- 🎨 RENDERUSDT.P: Opportunity of the Month
- 💎 ETHUSDT.P: Where to Retrace
- 🟢 BNBUSDT.P: Potential Surge
- 📊 BTC Dominance: Reaction Zone
- 🌊 WAVESUSDT.P: Demand Zone Potential
- 🟣 UNIUSDT.P: Long-Term Trade
- 🔵 XRPUSDT.P: Entry Zones
- 🔗 LINKUSDT.P: Follow The River
- 📈 BTCUSDT.P: Two Key Demand Zones
- 🟩 POLUSDT: Bullish Momentum
- 🌟 PENDLEUSDT.P: Where Opportunity Meets Precision
- 🔥 BTCUSDT.P: Liquidation of Highly Leveraged Longs
- 🌊 SOLUSDT.P: SOL's Dip - Your Opportunity
- 🐸 1000PEPEUSDT.P: Prime Bounce Zone Unlocked
- 🚀 ETHUSDT.P: Set to Explode - Don't Miss This Game Changer
- 🤖 IQUSDT: Smart Plan
- ⚡️ PONDUSDT: A Trade Not Taken Is Better Than a Losing One
- 💼 STMXUSDT: 2 Buying Areas
- 🐢 TURBOUSDT: Buy Zones and Buyer Presence
- 🌍 ICPUSDT.P: Massive Upside Potential | Check the Trade Update For Seeing Results
- 🟠 IDEXUSDT: Spot Buy Area | %26 Profit if You Trade with MSB
- 📌 USUALUSDT: Buyers Are Active + %70 Profit in Total
- 🌟 FORTHUSDT: Sniper Entry +%26 Reaction
- 🐳 QKCUSDT: Sniper Entry +%57 Reaction
- 📊 BTC.D: Retest of Key Area Highly Likely
- 📊 XNOUSDT %80 Reaction with a Simple Blue Box!
- 📊 BELUSDT Amazing %120 Reaction!
I stopped adding to the list because it's kinda tiring to add 5-10 charts in every move but you can check my profile and see that it goes on..
Professional Day Trader
Microstructure Practicioner
t.me/umuttrades
Microstructure Practicioner
t.me/umuttrades
Penerbitan berkaitan
Penafian
Maklumat dan penerbitan adalah tidak dimaksudkan untuk menjadi, dan tidak membentuk, nasihat untuk kewangan, pelaburan, perdagangan dan jenis-jenis lain atau cadangan yang dibekalkan atau disahkan oleh TradingView. Baca dengan lebih lanjut di Terma Penggunaan.