📊 Weekly Price Range (Sep 22–26, 2025)
High: ₹3,794.90
Low: ₹3,661.00
Closing Range: ₹3,642.15 – ₹3,731.10
Average Closing Price: ₹3,673.80
Trading Volume: Significantly above average, with 241,575 shares traded on September 26, compared to the 50-day average of 126,661 shares.
🔧 Technical Indicators
Relative Strength Index (RSI): Indicates bullish momentum.
Moving Averages: Both 50-day and 200-day moving averages suggest a positive trend.
MACD & Stochastic Oscillator: Both indicators are aligned with upward momentum.
Volume Delivery: High delivery volumes suggest strong investor confidence.
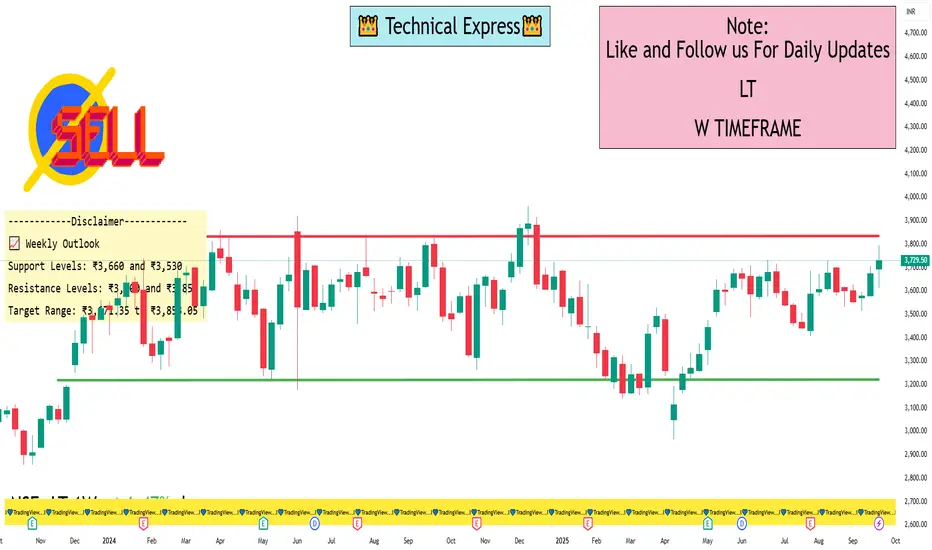
📈 Weekly Outlook
Support Levels: ₹3,660 and ₹3,530
Resistance Levels: ₹3,800 and ₹3,850
Target Range: ₹3,671.35 to ₹3,853.05
High: ₹3,794.90
Low: ₹3,661.00
Closing Range: ₹3,642.15 – ₹3,731.10
Average Closing Price: ₹3,673.80
Trading Volume: Significantly above average, with 241,575 shares traded on September 26, compared to the 50-day average of 126,661 shares.
🔧 Technical Indicators
Relative Strength Index (RSI): Indicates bullish momentum.
Moving Averages: Both 50-day and 200-day moving averages suggest a positive trend.
MACD & Stochastic Oscillator: Both indicators are aligned with upward momentum.
Volume Delivery: High delivery volumes suggest strong investor confidence.
📈 Weekly Outlook
Support Levels: ₹3,660 and ₹3,530
Resistance Levels: ₹3,800 and ₹3,850
Target Range: ₹3,671.35 to ₹3,853.05
I built a Buy & Sell Signal Indicator with 85% accuracy.
📈 Get access via DM or
WhatsApp: wa.link/d997q0
Contact - +91 76782 40962
| Email: techncialexpress@gmail.com
| Script Coder | Trader | Investor | From India
📈 Get access via DM or
WhatsApp: wa.link/d997q0
Contact - +91 76782 40962
| Email: techncialexpress@gmail.com
| Script Coder | Trader | Investor | From India
Penerbitan berkaitan
Penafian
Maklumat dan penerbitan adalah tidak bertujuan, dan tidak membentuk, nasihat atau cadangan kewangan, pelaburan, dagangan atau jenis lain yang diberikan atau disahkan oleh TradingView. Baca lebih dalam Terma Penggunaan.