Trading stocks using Dr. Elder's "Three Screen Method"
The first thing I do is check the weekly chart. Here I see excellent price divergence relative to the MACD indicator

Then I switched to the daily chart and saw the same excellent divergence as on the weekly chart.

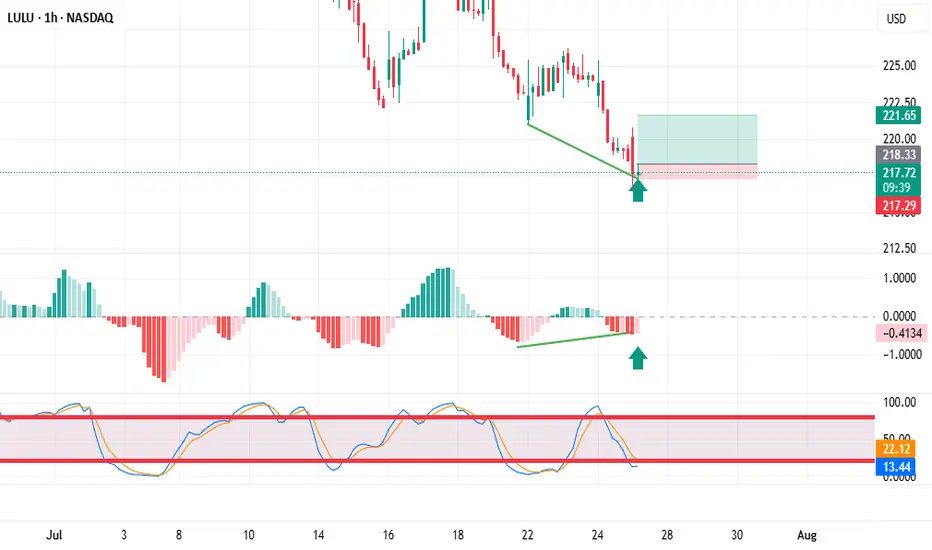
The hourly chart also showed excellent divergence. placed a pending buy order above the candle marked with an arrow.

Then I switched to the daily chart and saw the same excellent divergence as on the weekly chart.
The hourly chart also showed excellent divergence. placed a pending buy order above the candle marked with an arrow.
Dagangan aktif
the price has activated a buy orderNota
The trade was closed by stop loss, but the analysis is still relevant, I’m waiting for the signal candle and will re-enter the long positionNota
I will enter a trade at the top of the candle marked with an arrow, or at the next one if the buy order is not activated on the current candle.Nota
Placed a pending buy order above the signal candlePenafian
Maklumat dan penerbitan adalah tidak dimaksudkan untuk menjadi, dan tidak membentuk, nasihat untuk kewangan, pelaburan, perdagangan dan jenis-jenis lain atau cadangan yang dibekalkan atau disahkan oleh TradingView. Baca dengan lebih lanjut di Terma Penggunaan.
Penafian
Maklumat dan penerbitan adalah tidak dimaksudkan untuk menjadi, dan tidak membentuk, nasihat untuk kewangan, pelaburan, perdagangan dan jenis-jenis lain atau cadangan yang dibekalkan atau disahkan oleh TradingView. Baca dengan lebih lanjut di Terma Penggunaan.