Hello everyone
Let's take a look at the LUNA / USDT chart on the 1D interval.
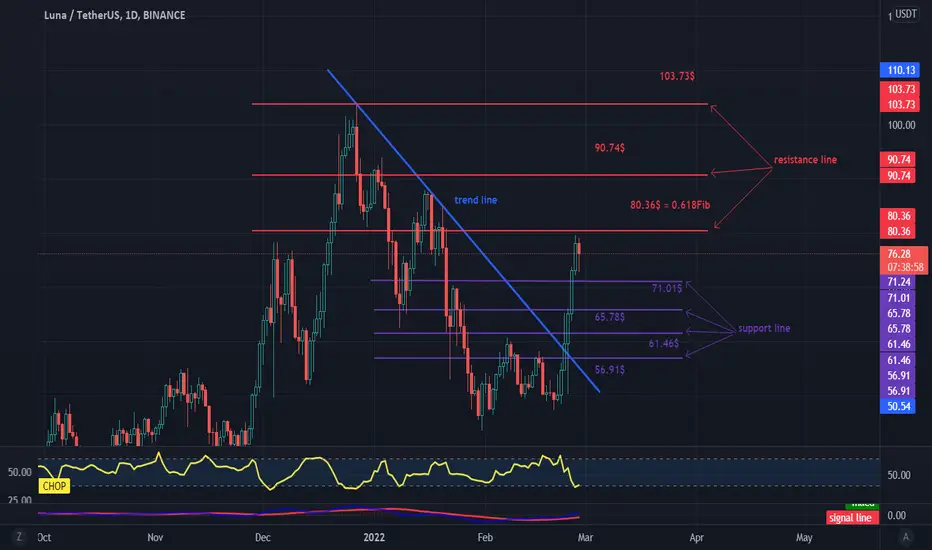
Let's start with determining the downtrend line which, as you can see, managed to break and the valuation shot up.
It is worth appointing a new support that has formed at the price of $ 71.01 and another one at $ 65.78, $ 61.46, $ 56.91.
Now let's move on to determining the resistance that the price has to overcome, we see that the first resistance is at $ 80.36 = 0.618Fib, the so-called golden point from which the price has rebounded once, another moama resistance at $ 90.74 and $ 103.73.
We will look at the CHOP and MACD indicators. The first indicates that we are slowly regaining our energy and the second is a continuation of the upward trend.
Let's take a look at the LUNA / USDT chart on the 1D interval.
Let's start with determining the downtrend line which, as you can see, managed to break and the valuation shot up.
It is worth appointing a new support that has formed at the price of $ 71.01 and another one at $ 65.78, $ 61.46, $ 56.91.
Now let's move on to determining the resistance that the price has to overcome, we see that the first resistance is at $ 80.36 = 0.618Fib, the so-called golden point from which the price has rebounded once, another moama resistance at $ 90.74 and $ 103.73.
We will look at the CHOP and MACD indicators. The first indicates that we are slowly regaining our energy and the second is a continuation of the upward trend.
Penafian
Maklumat dan penerbitan adalah tidak dimaksudkan untuk menjadi, dan tidak membentuk, nasihat untuk kewangan, pelaburan, perdagangan dan jenis-jenis lain atau cadangan yang dibekalkan atau disahkan oleh TradingView. Baca dengan lebih lanjut di Terma Penggunaan.
Penafian
Maklumat dan penerbitan adalah tidak dimaksudkan untuk menjadi, dan tidak membentuk, nasihat untuk kewangan, pelaburan, perdagangan dan jenis-jenis lain atau cadangan yang dibekalkan atau disahkan oleh TradingView. Baca dengan lebih lanjut di Terma Penggunaan.