Evidence pointing in favor:✨️📸
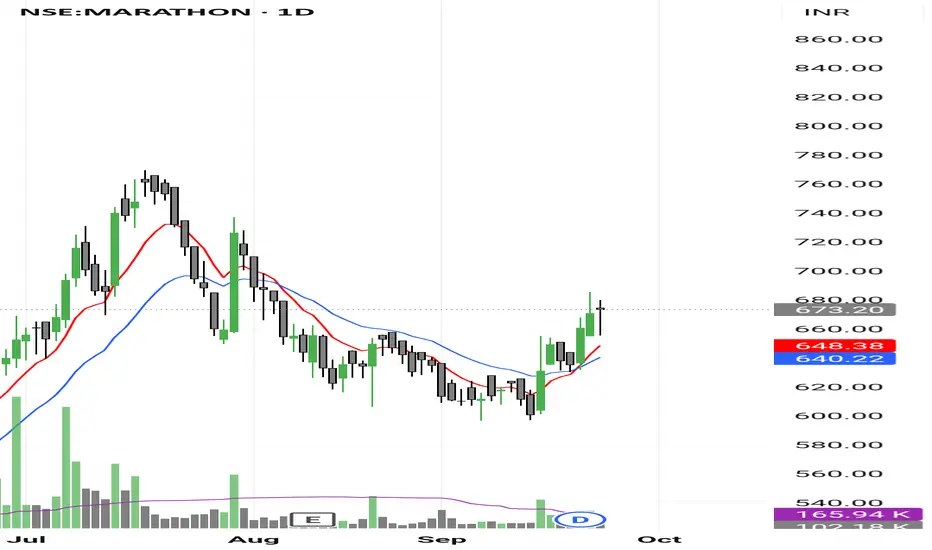
According to a technical summary on Investing.com, MARA’s indicators are strongly positive. All major moving averages (5, 10, 20, 50, 100, 200-day) are showing Buy signals.
The 50-day MA is above the 200-day MA (“golden cross” type scenario), which tends to be bullish.
Daily technical ratings are showing “Strong Buy.” The signal strength from RSI, MACD etc. are mostly aligned bullish.
What looks less clear / risk points:
While breakout signals are present (moving averages, momentum indicators), I didn’t find a clearly stated recent resistance level that’s been decisively broken (on large volume) in the sources I checked.
Overbought/overextension risk: some indicators are approaching “overbought” zones (e.g. RSI in higher ranges) which could mean short-term pullbacks are possible.
Need confirmation: strong moves on good volume, and a close above key resistance zones or trendlines would strengthen the breakout case.
---
✅ Conclusion (Short-Term Swing-Trade View)
Given the above:
Yes, there is evidence of a breakout or at least a strong bullish setup for MARA in short-term timeframes. The alignment of moving averages, momentum indicators, and the golden cross suggest potential for follow-through.
For swing-trading, a good entry would be after a confirming close above recent resistance (if you can see that on your chart), or on pullback to a support zone (say around the 50-day MA) with low risk stop.
Potential upside looks decent if the breakout holds. But watch for signs of exhaustion / negative news, especially in crypto markets (since MARA is crypto-exposed).
Penafian
Maklumat dan penerbitan adalah tidak dimaksudkan untuk menjadi, dan tidak membentuk, nasihat untuk kewangan, pelaburan, perdagangan dan jenis-jenis lain atau cadangan yang dibekalkan atau disahkan oleh TradingView. Baca dengan lebih lanjut di Terma Penggunaan.
Penafian
Maklumat dan penerbitan adalah tidak dimaksudkan untuk menjadi, dan tidak membentuk, nasihat untuk kewangan, pelaburan, perdagangan dan jenis-jenis lain atau cadangan yang dibekalkan atau disahkan oleh TradingView. Baca dengan lebih lanjut di Terma Penggunaan.