________________________________________________________________________________
🧠 MAXHEALTH – Symmetrical Triangle Breakout
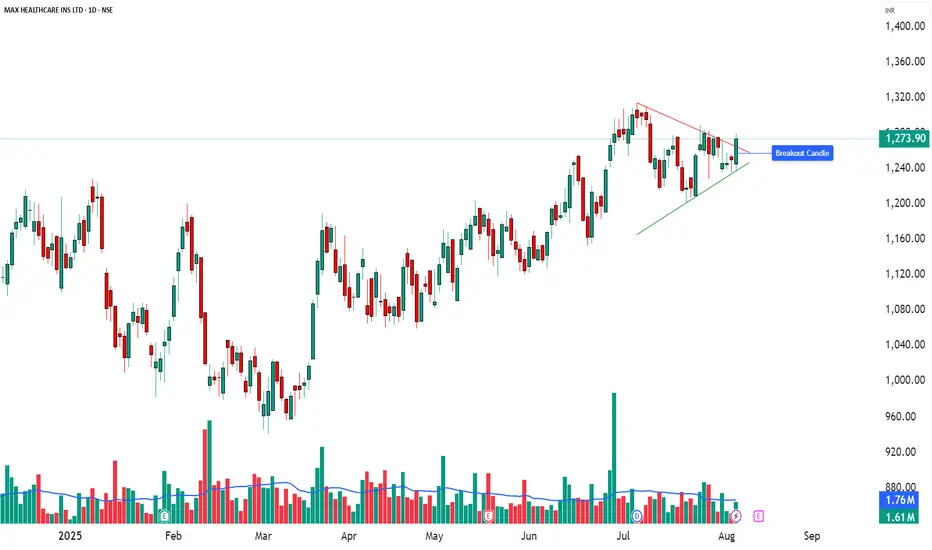
📌 Chart Overview
Symbol: `MAXHEALTH` (NSE)
Timeframe: 1D (Daily)
Pattern Identified: 🔺 Symmetrical Triangle
Breakout Confirmation: ✅ Bullish Engulfing
Volume on Breakout: 1.61M (above average)
________________________________________________________________________________
📊 Technical Breakdown (For Educational Use Only)
🔹 Between June and August, MAXHEALTH consolidated into a symmetrical triangle, a classic pattern suggesting price compression.
🔹 A bullish breakout occurred with a strong engulfing candle on above average volume — a potential early signal of trend continuation.
🔹 The breakout occurred near the apex of the triangle, increasing its validity.
💡 Such breakouts are commonly followed by retests or follow through moves. This post is intended to help learners spot and study such setups.
________________________________________________________________________________
📌 Key Reference Levels (Not Trade Levels)
As per the current chart structure, key reference levels for MAXHEALTH include resistance zones at ₹1,290.1, ₹1,306.3, and ₹1,332.6, which may act as potential supply areas in case of continued upward momentum. On the downside, important support zones are observed near ₹1,247.6, ₹1,221.3, and ₹1,205.1, where price could find buying interest if a pullback occurs. These levels are shared purely for technical context and educational study, not as trade recommendations.
________________________________________________________________________________
🧠 Learning Takeaways
✅ Symmetrical Triangle: Indicates indecision and tightening price range. Breakout direction often sets near term tone.
✅ Bullish Engulfing Candle: A strong reversal pattern when formed post consolidation or at trendline breaks.
✅ Volume Confirmation: Adds credibility to breakout strength — look for rising volume on breakouts.
🔍 Always watch for follow up candles, possible pullbacks (retest entries), or invalidation zones to study trade structure in real world setups.
________________________________________________________________________________
⚠️ Disclaimer & Educational Note
This content is strictly for educational and research purposes only. I am not a SEBI-registered advisor, and no buy/sell recommendations are being provided. All insights are based on personal analysis and experience and are not financial advice.
📘 This setup illustrates how combining price action (candlesticks), support/resistance zones, volume, and indicators like RSI or MACD can help build conviction in trades. However, trading—especially in derivatives like options—involves high risk, and losses can exceed the initial investment.
👉 Always do your own research and consult a SEBI-registered advisor before taking any position.
👉 Use strict risk management and only trade with capital you can afford to lose.
The author assumes no liability for any losses incurred.
By engaging with this content, you agree to these terms.
________________________________________________________________________________
💬 Found this helpful?
Drop your thoughts, questions, or insights in the comments below ⬇️ — let’s learn together!
🔁 Share this post with your trading friends and community — help them discover clean charts, structured setups, and zone-based learning.
✅ Follow simpletradewithpatience for clear setups, educational content, and a no-nonsense approach to price action, supply-demand zones, and risk-managed trades.
🚀 Trade with patience. Trust your charts. Stay clear-headed.
Because the goal is not just to trade — it's to trade better.
Be Self-Reliant | Trade with Patience | Learn with Charts & Zones 📊
🧠 MAXHEALTH – Symmetrical Triangle Breakout
📌 Chart Overview
Symbol: `MAXHEALTH` (NSE)
Timeframe: 1D (Daily)
Pattern Identified: 🔺 Symmetrical Triangle
Breakout Confirmation: ✅ Bullish Engulfing
Volume on Breakout: 1.61M (above average)
________________________________________________________________________________
📊 Technical Breakdown (For Educational Use Only)
🔹 Between June and August, MAXHEALTH consolidated into a symmetrical triangle, a classic pattern suggesting price compression.
🔹 A bullish breakout occurred with a strong engulfing candle on above average volume — a potential early signal of trend continuation.
🔹 The breakout occurred near the apex of the triangle, increasing its validity.
💡 Such breakouts are commonly followed by retests or follow through moves. This post is intended to help learners spot and study such setups.
________________________________________________________________________________
📌 Key Reference Levels (Not Trade Levels)
As per the current chart structure, key reference levels for MAXHEALTH include resistance zones at ₹1,290.1, ₹1,306.3, and ₹1,332.6, which may act as potential supply areas in case of continued upward momentum. On the downside, important support zones are observed near ₹1,247.6, ₹1,221.3, and ₹1,205.1, where price could find buying interest if a pullback occurs. These levels are shared purely for technical context and educational study, not as trade recommendations.
________________________________________________________________________________
🧠 Learning Takeaways
✅ Symmetrical Triangle: Indicates indecision and tightening price range. Breakout direction often sets near term tone.
✅ Bullish Engulfing Candle: A strong reversal pattern when formed post consolidation or at trendline breaks.
✅ Volume Confirmation: Adds credibility to breakout strength — look for rising volume on breakouts.
🔍 Always watch for follow up candles, possible pullbacks (retest entries), or invalidation zones to study trade structure in real world setups.
________________________________________________________________________________
⚠️ Disclaimer & Educational Note
This content is strictly for educational and research purposes only. I am not a SEBI-registered advisor, and no buy/sell recommendations are being provided. All insights are based on personal analysis and experience and are not financial advice.
📘 This setup illustrates how combining price action (candlesticks), support/resistance zones, volume, and indicators like RSI or MACD can help build conviction in trades. However, trading—especially in derivatives like options—involves high risk, and losses can exceed the initial investment.
👉 Always do your own research and consult a SEBI-registered advisor before taking any position.
👉 Use strict risk management and only trade with capital you can afford to lose.
The author assumes no liability for any losses incurred.
By engaging with this content, you agree to these terms.
________________________________________________________________________________
💬 Found this helpful?
Drop your thoughts, questions, or insights in the comments below ⬇️ — let’s learn together!
🔁 Share this post with your trading friends and community — help them discover clean charts, structured setups, and zone-based learning.
✅ Follow simpletradewithpatience for clear setups, educational content, and a no-nonsense approach to price action, supply-demand zones, and risk-managed trades.
🚀 Trade with patience. Trust your charts. Stay clear-headed.
Because the goal is not just to trade — it's to trade better.
Be Self-Reliant | Trade with Patience | Learn with Charts & Zones 📊
STWP | Mentor & Demand-Supply Specialist | Empowering traders through structured learning |
simpletradewithpatience.com
Community: chat.whatsapp.com/BEYz0tkqP0fJPBCWf59uel
wa.me/message/6IOPHGOXMGZ4N1
Educational Only
simpletradewithpatience.com
Community: chat.whatsapp.com/BEYz0tkqP0fJPBCWf59uel
wa.me/message/6IOPHGOXMGZ4N1
Educational Only
Penafian
Maklumat dan penerbitan adalah tidak bertujuan, dan tidak membentuk, nasihat atau cadangan kewangan, pelaburan, dagangan atau jenis lain yang diberikan atau disahkan oleh TradingView. Baca lebih dalam Terma Penggunaan.