🔎 Detailed Analysis
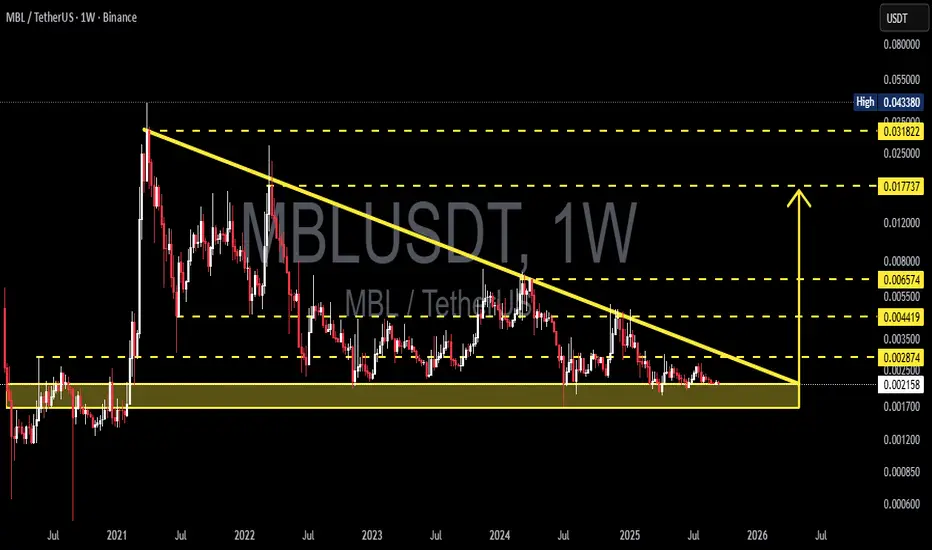
The MBL/USDT pair on the weekly chart is currently in a long-term price compression phase. The structure forms a Descending Triangle, characterized by:
Consistent lower highs along a long-term descending trendline (since 2021).
A strong horizontal support zone at 0.0017 – 0.0023 USDT (yellow box).
Price action consolidating into the triangle apex, suggesting a potential major breakout or breakdown in the coming weeks/months.
This pattern has been building for over 3 years, which makes any confirmed breakout highly significant.
---
📈 Bullish Scenario
Confirmation: A weekly close above the descending trendline and pivot level at 0.002874 USDT, supported by strong volume.
Retest: A successful retest of the breakout level turning into support strengthens the case for upside continuation.
Bullish Targets:
Target 1: 0.004419 USDT (nearest resistance).
Target 2: 0.006574 USDT.
Extended Target: 0.0177 – 0.0318 USDT if broader altcoin momentum strengthens.
✨ If this bullish breakout occurs, it could mark the beginning of a major reversal after years of consolidation.
---
📉 Bearish Scenario
Confirmation: A weekly close below the 0.0017 USDT support zone with strong bearish follow-through.
Implication: A breakdown of this historical support could open the door to much lower levels (sub-0.001), with an extreme projection toward 0.0006 USDT.
Note: Descending triangles often resolve bearishly in textbook cases, but in crypto they can also serve as accumulation zones before explosive rallies.
---
🛡️ Risk Management
Avoid entering positions solely because the price “looks cheap” — wait for clear confirmation.
Always set a Stop Loss below support (for longs) or above invalidation (for shorts).
Manage position sizing carefully → high reward potential but also high risk.
Use indicators (RSI, MACD, Volume) to confirm momentum shifts.
Weekly close is the strongest signal — avoid acting on intraday noise.
---
⏳ Timeframe & Potential
As this is a weekly timeframe pattern, confirmation may take several weeks to months.
The closer price gets to the triangle apex, the more explosive the breakout is likely to be.
Broader altcoin market sentiment will strongly influence which direction this resolves.
---
✨ Conclusion
MBL/USDT is at a critical crossroads:
Holding the 0.0017 – 0.0023 support and breaking the descending trendline could trigger a multi-fold rally.
Losing this support zone could lead to a sharp drop into uncharted sub-0.001 territory.
📍 This setup is highly attractive for swing traders and mid-to-long term investors waiting for a major move after extended consolidation.
---
#MBL #MBLUSDT #Crypto #Altcoins #TechnicalAnalysis #DescendingTriangle #Support #Breakout #Bullish #Bearish
✅ Get Free Signals! Join Our Telegram Channel Here: t.me/TheCryptoNuclear
✅ Twitter: twitter.com/crypto_nuclear
✅ Join Bybit : partner.bybit.com/b/nuclearvip
✅ Benefits : Lifetime Trading Fee Discount -50%
✅ Twitter: twitter.com/crypto_nuclear
✅ Join Bybit : partner.bybit.com/b/nuclearvip
✅ Benefits : Lifetime Trading Fee Discount -50%
Penafian
Maklumat dan penerbitan adalah tidak bertujuan, dan tidak membentuk, nasihat atau cadangan kewangan, pelaburan, dagangan atau jenis lain yang diberikan atau disahkan oleh TradingView. Baca lebih dalam Terma Penggunaan.