Hello, traders.
If you "Follow", you can always get new information quickly.
Have a nice day today.
-------------------------------------
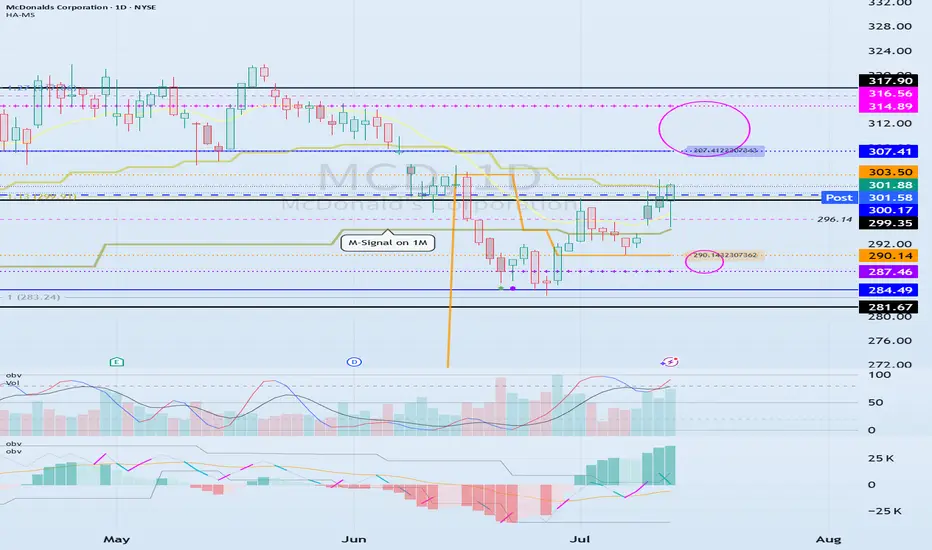
(MCD 1D chart)
Before following the basic trading strategy, the first thing to check is whether the current price is above or below the M-Signal indicator on the 1M chart.
If the price is below the M-Signal indicator on the 1M chart, there is a possibility that it will turn into a medium- to long-term downtrend.
Therefore, if possible, it is recommended to trade stocks whose prices are above the M-Signal indicator on the 1M chart.
If the price is below the M-Signal indicator on the 1M chart, you should respond quickly and briefly using the short-term trading (day trading) method.
-
The support and resistance zones can be seen as the 287.46-290.14 zone and the 307.41-314.89 zone.
The 287.46-290.14 zone is the DOM(-60) ~ HA-Low zone, and the 307.41-314.89 zone is the HA-High ~ DOM(60) zone.
These two zones are likely to form a trend depending on how they break through, so they can be seen as support and resistance zones.
-
The 300.17-316.56 zone is the HA-High ~ DOM(60) zone on the 1W chart.
Therefore, we need to check whether it can receive support and rise in the 300.17-316.56 zone.
Therefore, if it falls near the 307.41-314.89 range, you should check for support near 300.17.
-
If it rises above the HA-High ~ DOM(60) range, it is likely to show a step-up trend, and if it falls in the DOM(-60) ~ HA-Low range, it is likely to show a step-down trend.
-
Thank you for reading to the end.
I hope you have a successful transaction.
--------------------------------------------------
※ Follow X to check out the posts.
※ X를 팔로우하고 게시물을 확인하세요.
◆ t.me/readCryptoChannel
[HA-MS Indicator]
bit.ly/3YxHgvN
[OBV Indicator]
bit.ly/4dcyny3
※ X를 팔로우하고 게시물을 확인하세요.
◆ t.me/readCryptoChannel
[HA-MS Indicator]
bit.ly/3YxHgvN
[OBV Indicator]
bit.ly/4dcyny3
Penafian
Maklumat dan penerbitan adalah tidak bertujuan, dan tidak membentuk, nasihat atau cadangan kewangan, pelaburan, dagangan atau jenis lain yang diberikan atau disahkan oleh TradingView. Baca lebih dalam Terma Penggunaan.