Bullish for the midterm/longterm...
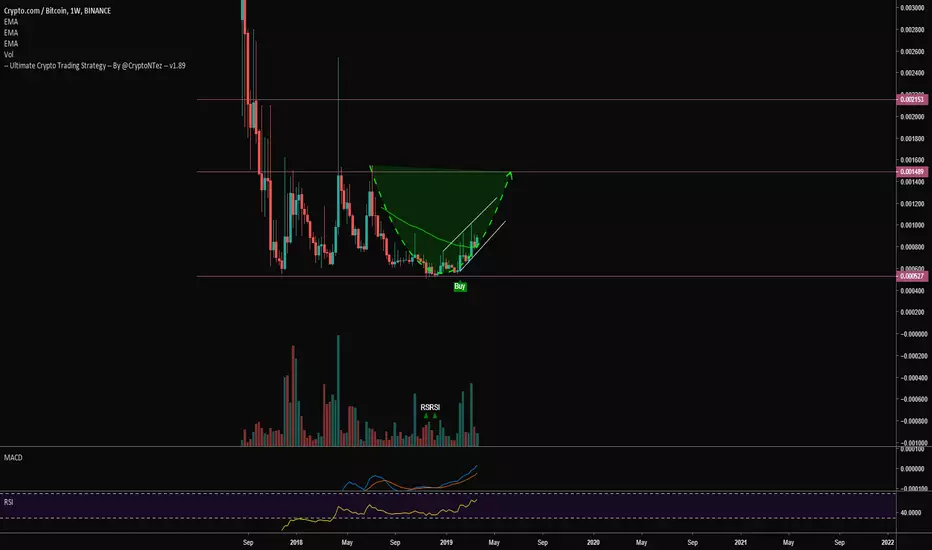
Looking at the weekly chart we can see a recurrent pattern(3 executions) from botton to top (500-1500sats)..
I think we can be running a 4th iteration with a slower pace
Notice the UCTS buy signal (STRONG SIGNAL)
Also Volume is at really high lvls.
Moving into 2D chart...
Price crossing EMA200 which is a bullish signal, Both MACD & RSI rising with RSI near Overbought levels...
Holding the ascending trend line is key to sustain the movement..
Buying here after a 60% run sounds risky but think about long term possibilities...
UCTS Indicator? Get a 10 days FREE trial at Cryptontez.com
Improve your Crypto Trading with 3commas. 3commas.io/?c=Cryptontez
Telegram Group: t.me/CryptontezTA
Improve your Crypto Trading with 3commas. 3commas.io/?c=Cryptontez
Telegram Group: t.me/CryptontezTA
Penafian
Maklumat dan penerbitan adalah tidak dimaksudkan untuk menjadi, dan tidak membentuk, nasihat untuk kewangan, pelaburan, perdagangan dan jenis-jenis lain atau cadangan yang dibekalkan atau disahkan oleh TradingView. Baca dengan lebih lanjut di Terma Penggunaan.