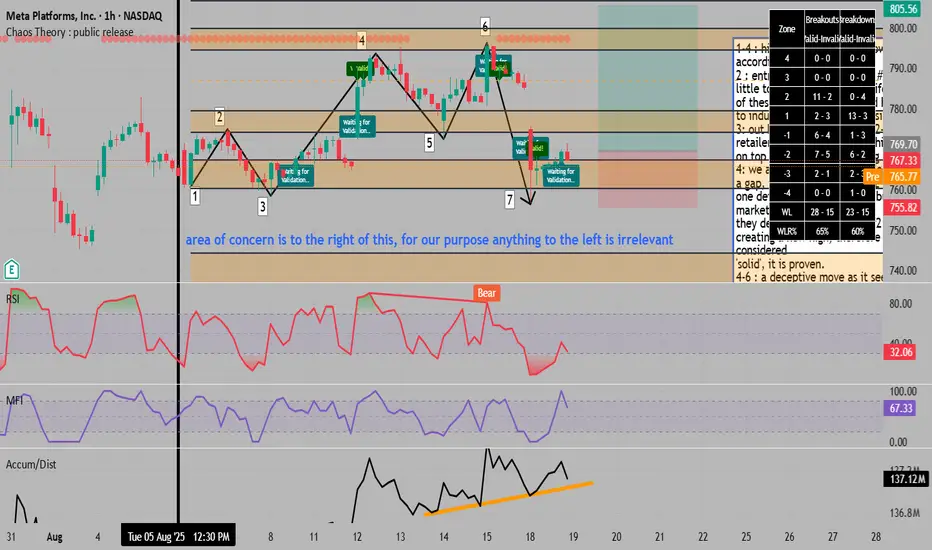
1-4 : higher high and higher lows , upward structure
according to dow theory
2 : entrance of sellers to test #1, very strong sellers with
little to no resistance, the uniformity and similarity
of these bars is suspicious and hints at external intervention,
to induce people to the downside.
3: out buyers enter, with the 2-3 downtrend I could see most
retailers not thinking any of this structure is meaningful,
on top of that probably having a stop above 2
4: we are pushed to the upside with strength, even creating
a gap, the stop orders above 2 got liquidated (ouch!) ,
one detail to note is that the buyers at #3 are now in control of the market,
they defeated the sellers at #2 by taking out their orders and
creating a new high, therefore the genesis of these buyers is considered
'solid', it is proven.
4-6 : a deceptive move as it seems to be a higher high which ,
woudl maybe make people think 5 is a solid low and stronger than the sellers at 4,
but if you draw a horizontal line, it simply is not the case.
7 : a return to the solid structure at 3, high volitlity which is good
as a confluence to the upside, because after high volitlity we
normally have a nice flow establish in the opposing direction
* what do I think will happen ?
* the candle at #7 is an attempt to scare off entrance to where major
players are entering, this is a great entry with a stop loss below #3 ,
likely this is where major market movers have their stop loss and they
will defend this area unless I am wrong.
* accumulation/distribution is giving us a hidden divergence , nothing
from mfi and rsi except oversold, which I do not trust in high volitlity / strong
moves.
* over the past 2,500 candles , price has reached the next orange zone if it closes out on one side
of the zone , you can manually verify by reducing the lookback period and counting, only realtime
tradeable bars / zones are counted in stats.
* in conclusion we want a buy order.
* we will expect the next leg up here, so reach for a tp at the zone above 6,
breaking even at the 6 high in case it's just a pullback.
for trading mentorship and community, message me on telegram : jacesabr_real
Penafian
Maklumat dan penerbitan adalah tidak dimaksudkan untuk menjadi, dan tidak membentuk, nasihat untuk kewangan, pelaburan, perdagangan dan jenis-jenis lain atau cadangan yang dibekalkan atau disahkan oleh TradingView. Baca dengan lebih lanjut di Terma Penggunaan.