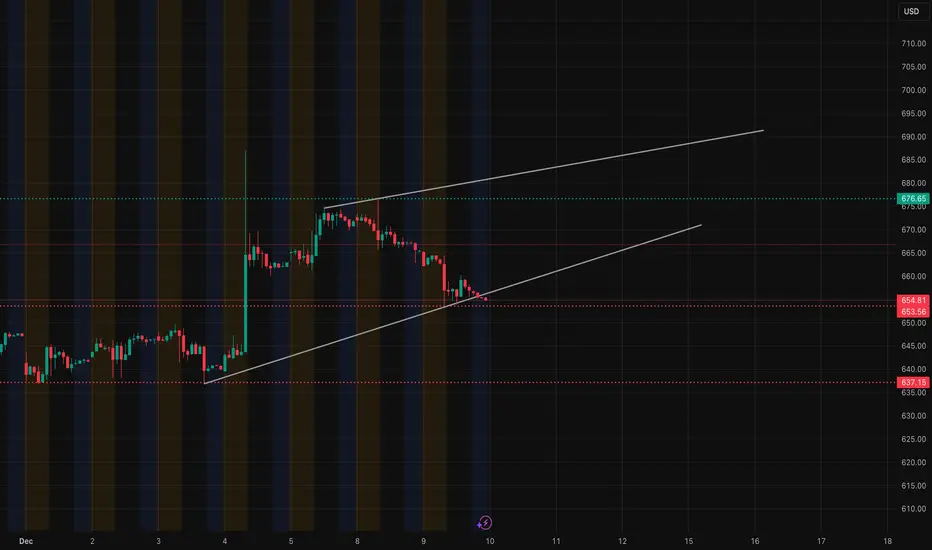
META is in a tricky spot right now. The 1H chart shows price grinding along the rising trendline that has been supporting the entire December move. Buyers have been defending that line, but the structure has weakened with lower highs forming on every bounce. The trendline is now being tested again, and momentum continues to fade.
If META loses this 1H trendline, the next demand doesn’t show up until the 642–650 zone — the exact area highlighted by the 15M chart and confirmed by the GEX put-support levels. So the downside path is clean if the trendline gives way.

On the 15M chart, price has been compressing under a descending trendline. Sellers have the upper hand intraday — every bounce is getting sold off quickly, and the tape keeps drifting back toward the red liquidity zone at 653–654. META needs to reclaim the breakdown zone near 662–665 to flip the tone back to bullish; otherwise, the structure is still leaning downward.

The GEX layout matches the chart almost perfectly. Strongest positive gamma sits all the way up at 670–680 — nowhere near current price — which tells us dealers aren’t defending the downside. Meanwhile, the put support walls at 653 and 642 are located exactly at the two major technical demand zones on 1H and 15M charts. When price stalls right on top of these put walls, it usually means the market is waiting for liquidity before the next move.
Because META is trading inside the red liquidity box and under the 662–665 rejection zone, the GEX map confirms that the path of least resistance is still lower unless bulls step in with force.
My thoughts:
META is in a bearish bias short-term unless it reclaims 662–665. If that level stays resistance, the chart and GEX both point toward a potential flush into 653 first, and then the deeper 642–645 zone if that breaks. Those are the only areas where I'd expect real buyers to show.
If the 1H trendline somehow holds again and price breaks above the descending trendline on the 15M, then a recovery toward 670 becomes possible — but META must break structure before any upside becomes meaningful.
Disclaimer: This analysis is for educational purposes only and is not financial advice. Always do your own research and manage your risk before trading.
If META loses this 1H trendline, the next demand doesn’t show up until the 642–650 zone — the exact area highlighted by the 15M chart and confirmed by the GEX put-support levels. So the downside path is clean if the trendline gives way.
On the 15M chart, price has been compressing under a descending trendline. Sellers have the upper hand intraday — every bounce is getting sold off quickly, and the tape keeps drifting back toward the red liquidity zone at 653–654. META needs to reclaim the breakdown zone near 662–665 to flip the tone back to bullish; otherwise, the structure is still leaning downward.
The GEX layout matches the chart almost perfectly. Strongest positive gamma sits all the way up at 670–680 — nowhere near current price — which tells us dealers aren’t defending the downside. Meanwhile, the put support walls at 653 and 642 are located exactly at the two major technical demand zones on 1H and 15M charts. When price stalls right on top of these put walls, it usually means the market is waiting for liquidity before the next move.
Because META is trading inside the red liquidity box and under the 662–665 rejection zone, the GEX map confirms that the path of least resistance is still lower unless bulls step in with force.
My thoughts:
META is in a bearish bias short-term unless it reclaims 662–665. If that level stays resistance, the chart and GEX both point toward a potential flush into 653 first, and then the deeper 642–645 zone if that breaks. Those are the only areas where I'd expect real buyers to show.
If the 1H trendline somehow holds again and price breaks above the descending trendline on the 15M, then a recovery toward 670 becomes possible — but META must break structure before any upside becomes meaningful.
Disclaimer: This analysis is for educational purposes only and is not financial advice. Always do your own research and manage your risk before trading.
Penafian
Maklumat dan penerbitan adalah tidak bertujuan, dan tidak membentuk, nasihat atau cadangan kewangan, pelaburan, dagangan atau jenis lain yang diberikan atau disahkan oleh TradingView. Baca lebih dalam Terma Penggunaan.
Penafian
Maklumat dan penerbitan adalah tidak bertujuan, dan tidak membentuk, nasihat atau cadangan kewangan, pelaburan, dagangan atau jenis lain yang diberikan atau disahkan oleh TradingView. Baca lebih dalam Terma Penggunaan.