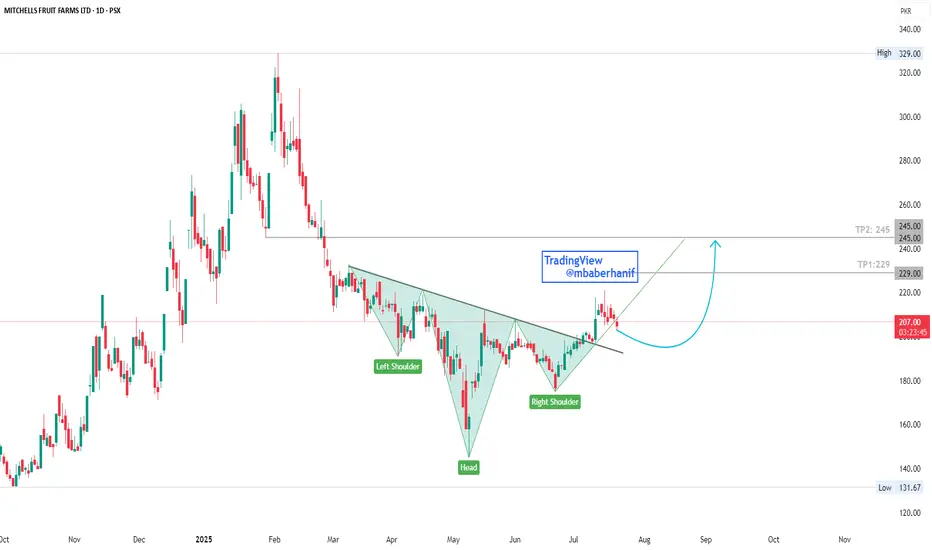
📊 Technical Analysis Summary:
Pattern: Inverse Head and Shoulders
Left Shoulder: March 2025
Head: May 2025
Right Shoulder: June 2025
Neckline Breakout: Price has recently broken above the neckline, confirming the pattern.
Current Price: PKR 207
Support Zone: The price is currently retesting the neckline/support zone around 205–210.
Expected Move: A short-term pullback toward the neckline may occur before a bullish continuation.
Target Level: Based on the pattern projection, the target lies near PKR 229 and then 245, which also aligns with a previous resistance zone.
Trendline Support: A rising green trendline offers dynamic support, helping price structure stay bullish.
🟢 Bullish Signals:
Successful breakout from a bullish reversal pattern
Retest of neckline acting as potential support
Volume confirmation may further validate the move
🔴 Risk to Monitor:
Failure to hold above the 205 support zone might invalidate the breakout
Broader market weakness could impact the setup
Conclusion:
The chart presents a strong bullish setup with an Inverse Head and Shoulders breakout. A retest near 205 could offer a good entry with a potential upside toward 229 and then 245. Risk management is essential if price fails to hold above neckline support.
Penafian
Maklumat dan penerbitan adalah tidak bertujuan, dan tidak membentuk, nasihat atau cadangan kewangan, pelaburan, dagangan atau jenis lain yang diberikan atau disahkan oleh TradingView. Baca lebih dalam Terma Penggunaan.
Penafian
Maklumat dan penerbitan adalah tidak bertujuan, dan tidak membentuk, nasihat atau cadangan kewangan, pelaburan, dagangan atau jenis lain yang diberikan atau disahkan oleh TradingView. Baca lebih dalam Terma Penggunaan.
