📊 Pattern Analysis
1. Pole Formation:
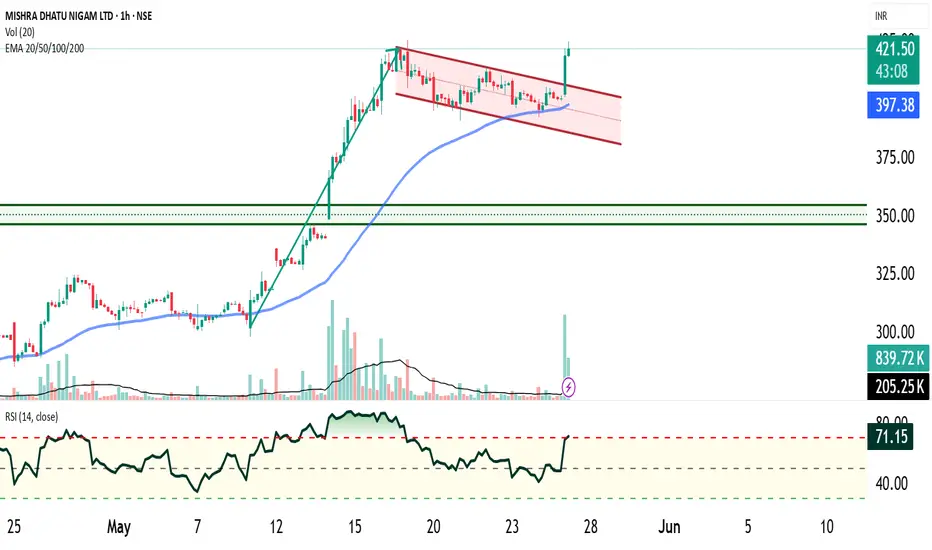
The initial rally forming the flagpole is marked by high-momentum bullish candles rising at approximately a 60° angle, supported by increasing volume, indicating strong institutional buying and trend conviction.
2. Flag Formation:
Following the pole, the stock entered a consolidation phase forming a downward-sloping parallel channel (the flag). This retracement occurred on declining volume, a classic sign of a healthy correction with no aggressive selling pressure — reinforcing the validity of a bullish flag.
3. Breakout Confirmation:
The stock has now broken out above the flag resistance with a large bullish candle and surge in volume, confirming the continuation of the prior uptrend. The breakout candle shows a decisive close above the flag range, indicating strong buyer interest.
📈 Technical Indicators
🎯 Trade Setup
Parameter Level
Entry On breakout confirmation or minor pullback
Target Height of the pole added to breakout point
Stop-Loss Below the recent swing low (bottom of flag) or trailing SL aligned with the 50 EMA
Risk-Reward Favorable – allows strategic trailing of profits
📌 Example Calculation:
If the pole is ₹80 high and the breakout occurred at ₹320, target = ₹400.
📌 Conclusion
MIDHANI has confirmed a textbook bullish flag breakout with strong technicals in place:
🔁 Call to Action
✅ Follow for more updates
👍 Like if you found this analysis helpful
📤 Share with your friends and fellow traders
1. Pole Formation:
The initial rally forming the flagpole is marked by high-momentum bullish candles rising at approximately a 60° angle, supported by increasing volume, indicating strong institutional buying and trend conviction.
2. Flag Formation:
Following the pole, the stock entered a consolidation phase forming a downward-sloping parallel channel (the flag). This retracement occurred on declining volume, a classic sign of a healthy correction with no aggressive selling pressure — reinforcing the validity of a bullish flag.
3. Breakout Confirmation:
The stock has now broken out above the flag resistance with a large bullish candle and surge in volume, confirming the continuation of the prior uptrend. The breakout candle shows a decisive close above the flag range, indicating strong buyer interest.
📈 Technical Indicators
- Volume: Volume has spiked significantly on the breakout day, validating the move.
- 50 EMA: Price has respected the 50-day EMA, which has acted as dynamic support throughout the flag formation.
- RSI: The Relative Strength Index is currently above 65, indicating strong bullish momentum but still below overbought levels, allowing room for further upside.
🎯 Trade Setup
Parameter Level
Entry On breakout confirmation or minor pullback
Target Height of the pole added to breakout point
Stop-Loss Below the recent swing low (bottom of flag) or trailing SL aligned with the 50 EMA
Risk-Reward Favorable – allows strategic trailing of profits
📌 Example Calculation:
If the pole is ₹80 high and the breakout occurred at ₹320, target = ₹400.
📌 Conclusion
MIDHANI has confirmed a textbook bullish flag breakout with strong technicals in place:
- High-angle pole on volume,
- Shallow flag pullback with weak volume,
- Breakout with rising momentum and EMA support.
- This setup suggests a strong trend continuation and offers an attractive opportunity for momentum traders and swing positions.
🔁 Call to Action
✅ Follow for more updates
👍 Like if you found this analysis helpful
📤 Share with your friends and fellow traders
Penafian
Maklumat dan penerbitan adalah tidak dimaksudkan untuk menjadi, dan tidak membentuk, nasihat untuk kewangan, pelaburan, perdagangan dan jenis-jenis lain atau cadangan yang dibekalkan atau disahkan oleh TradingView. Baca dengan lebih lanjut di Terma Penggunaan.
Penafian
Maklumat dan penerbitan adalah tidak dimaksudkan untuk menjadi, dan tidak membentuk, nasihat untuk kewangan, pelaburan, perdagangan dan jenis-jenis lain atau cadangan yang dibekalkan atau disahkan oleh TradingView. Baca dengan lebih lanjut di Terma Penggunaan.
