Marsh & McLennan (MMC): Complex Correction Nearing Completion
Wave Structure
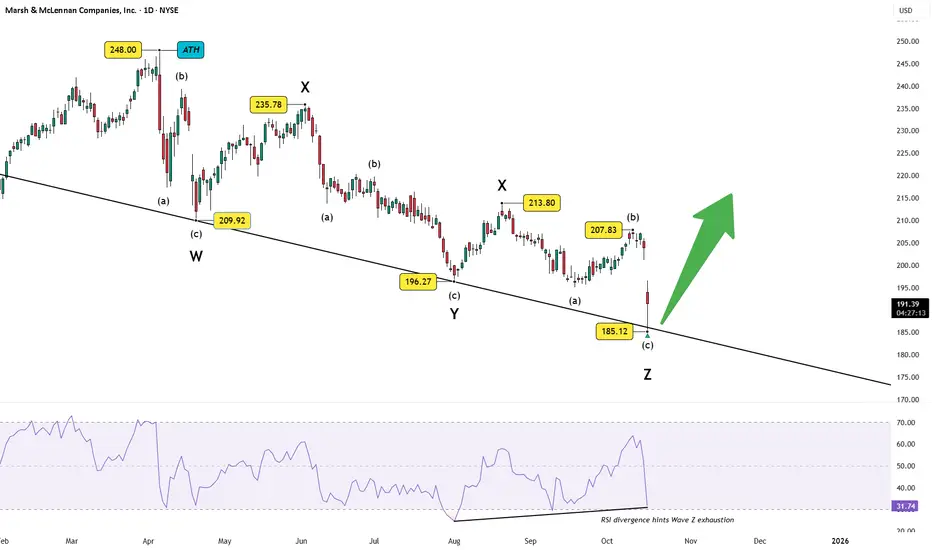
The larger decline from the 2024 peak at 248.00 appears to have unfolded as a five-part complex combination (W–X–Y–X–Z).
Each leg subdivides neatly into corrective (a–b–c) formations, with Wave Z recently tagging the long-term support trendline connecting prior W–Y lows around 185.
RSI Window
RSI is flashing a bullish divergence — higher lows in RSI versus lower lows in price — hinting that downside momentum is fading. This setup often precedes the end of complex corrections.
A sustained rebound above 200–207.83 could confirm that Wave Z has completed, paving the way for a fresh impulsive advance.
Fundamental Context

Under the hood, Marsh & McLennan continues to show resilience:
Together, these metrics support the view that the recent technical correction is more of a valuation reset than a structural breakdown.
Summary
Wave Z’s completion zone aligns with both technical exhaustion (RSI divergence, channel support) and fundamental stability — a combination that often sparks medium-term trend reversals.
Keep an eye on momentum confirmation above 207.83; it could mark the start of a new impulsive wave higher.
Disclaimer: This analysis is for educational purposes only and does not constitute investment advice. Please do your own research (DYOR) before making any trading decisions.
The larger decline from the 2024 peak at 248.00 appears to have unfolded as a five-part complex combination (W–X–Y–X–Z).
Each leg subdivides neatly into corrective (a–b–c) formations, with Wave Z recently tagging the long-term support trendline connecting prior W–Y lows around 185.
RSI Window
RSI is flashing a bullish divergence — higher lows in RSI versus lower lows in price — hinting that downside momentum is fading. This setup often precedes the end of complex corrections.
A sustained rebound above 200–207.83 could confirm that Wave Z has completed, paving the way for a fresh impulsive advance.
Fundamental Context
Under the hood, Marsh & McLennan continues to show resilience:
- Free Cash Flow has climbed steadily to $3.99 B (FY 2024).
- Revenue doubled over the past decade to $24.4 B, highlighting strong business traction.
- Debt levels remain contained around $19 B, and the P/E ratio near 22.8 reflects a healthy, not overheated, valuation.
Together, these metrics support the view that the recent technical correction is more of a valuation reset than a structural breakdown.
Summary
Wave Z’s completion zone aligns with both technical exhaustion (RSI divergence, channel support) and fundamental stability — a combination that often sparks medium-term trend reversals.
Keep an eye on momentum confirmation above 207.83; it could mark the start of a new impulsive wave higher.
Disclaimer: This analysis is for educational purposes only and does not constitute investment advice. Please do your own research (DYOR) before making any trading decisions.
WaveXplorer | Elliott Wave insights
📊 X profile: @veerappa89
📊 X profile: @veerappa89
Penerbitan berkaitan
Penafian
Maklumat dan penerbitan adalah tidak bertujuan, dan tidak membentuk, nasihat atau cadangan kewangan, pelaburan, dagangan atau jenis lain yang diberikan atau disahkan oleh TradingView. Baca lebih dalam Terma Penggunaan.