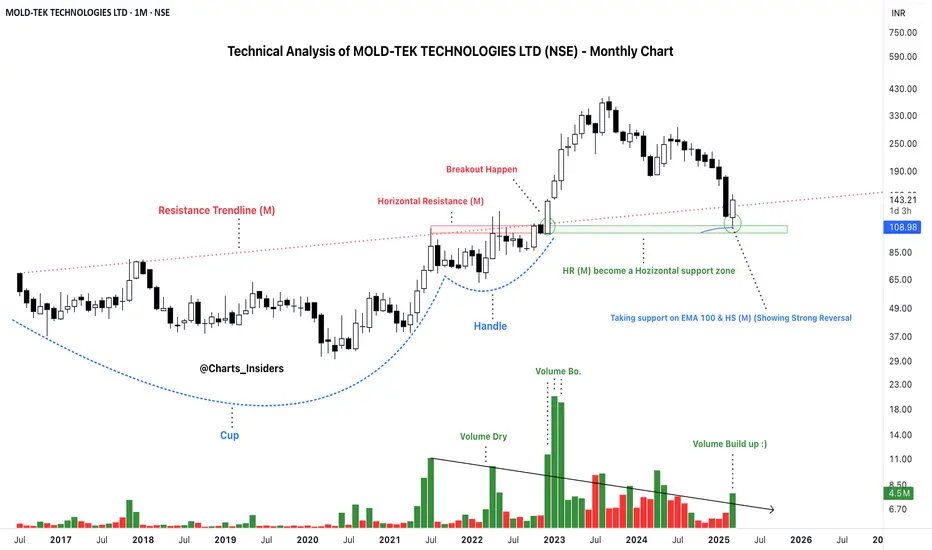
Technical Analysis of MOLD-TEK TECHNOLOGIES LTD (NSE) - Monthly

Chart Pattern: Cup and Handle Breakout with Retest
The chart displays a cup and handle pattern that completed a breakout in early 2023.
The price surged significantly post-breakout, reaching new highs.
However, after the sharp uptrend, the stock has corrected and is now retesting the breakout zone, which aligns with a long-term trendline.
Key Technical Observations
1. Support and Demand Zone (Retest of Breakout)
The stock has fallen from its highs and is currently testing a critical support zone around ₹120 - ₹145. This zone represents the previous breakout level from the cup and handle pattern.
A strong bounce from this area suggests that buyers are defending this demand zone.
2. Long-Term Trendline Support
The red diagonal trendline, drawn from past swing highs, has historically acted as resistance.
After the breakout, this trendline is now acting as a support.
The stock has bounced off this trendline, indicating a potential reversal.
3. Volume Analysis
Increased volume was seen during the cup and handle breakout, confirming the strength of the move.
Recent volume spikes on the dip suggest accumulation by strong hands.
A rise in volume on a reversal would confirm buyer strength.
4. Fibonacci Retracement & Mean Reversion
The current correction aligns with a 50%-61.8% Fibonacci retracement from the previous rally.
This is a healthy retracement level, often indicating the end of a correction.
Mean reversion to previous support zones before resuming the uptrend is common in strong stocks.
5. RSI & Momentum Indicators
While RSI is not explicitly shown in the image, the deep correction suggests oversold conditions.
A bullish divergence (price making lower lows, but RSI making higher lows) would strengthen the reversal case.
Conclusion & Strategy
Bullish Case (If the stock holds ₹120 - ₹145)
If the stock sustains this level and forms a higher low, it could resume an uptrend.
Breakout confirmation would come if the price reclaims ₹180 - ₹200 with strong volume.
Potential targets: ₹250, ₹280, and ₹350 in the long run.
Bearish Case (If ₹120 breaks)
A breakdown below ₹120 could lead to further downside, possibly towards ₹90 or even ₹68.
This would invalidate the bullish retest scenario.
Action Plan
For Long-Term Investors: This could be a buying opportunity if support holds.
For Traders: Look for bullish confirmation before entering. Stop-loss near ₹120.
Penafian
Maklumat dan penerbitan adalah tidak dimaksudkan untuk menjadi, dan tidak membentuk, nasihat untuk kewangan, pelaburan, perdagangan dan jenis-jenis lain atau cadangan yang dibekalkan atau disahkan oleh TradingView. Baca dengan lebih lanjut di Terma Penggunaan.
Penafian
Maklumat dan penerbitan adalah tidak dimaksudkan untuk menjadi, dan tidak membentuk, nasihat untuk kewangan, pelaburan, perdagangan dan jenis-jenis lain atau cadangan yang dibekalkan atau disahkan oleh TradingView. Baca dengan lebih lanjut di Terma Penggunaan.