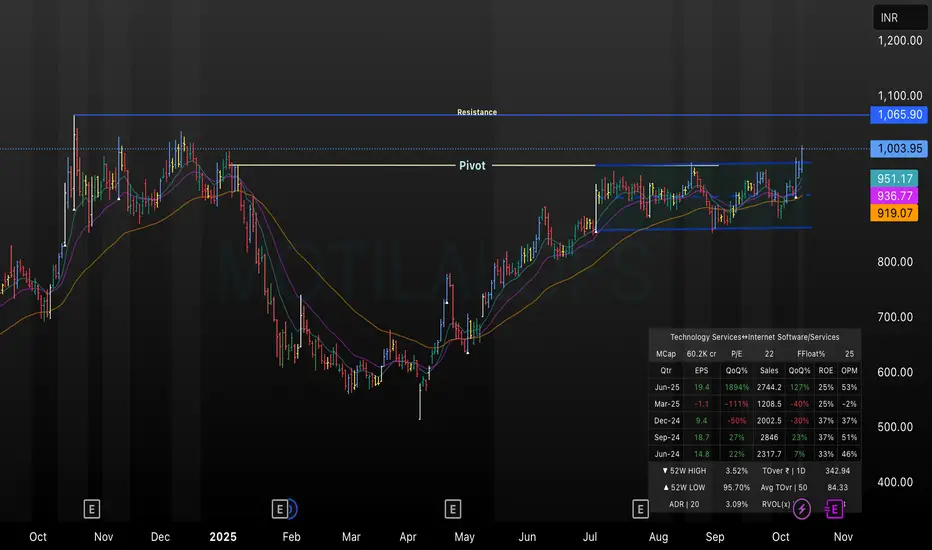
This TradingView chart for Motilal Oswal shows a clear price breakout above the key pivot level near ₹1,003.95, heading towards the marked resistance at ₹1,065.90. The chart uses daily candles and overlays short-to-medium-term EMAs, highlighting recent bullish momentum. The setup suggests a potential trend continuation if the resistance is breached, with all technicals and critical financial data displayed for context.
Penafian
The information and publications are not meant to be, and do not constitute, financial, investment, trading, or other types of advice or recommendations supplied or endorsed by TradingView. Read more in the Terms of Use.
Penafian
The information and publications are not meant to be, and do not constitute, financial, investment, trading, or other types of advice or recommendations supplied or endorsed by TradingView. Read more in the Terms of Use.