Fundamental Analysis
Financial Performance
Key Product Challenges
Growth Highlights
Pipeline and Innovation
Dividend Profile
Technical Analysis
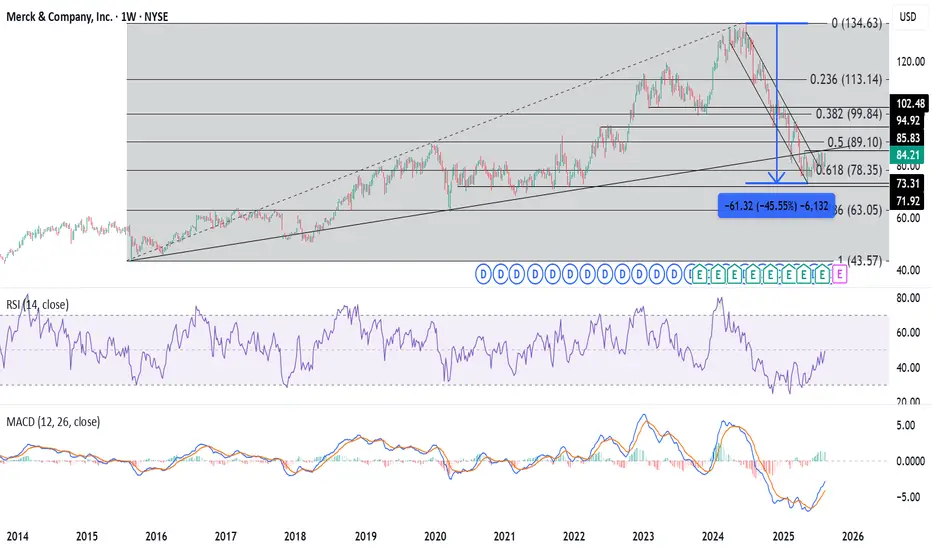
The stock price has fallen by over 45% from its ATH of $134.63 in June 2024. The price seems to be consolidating within the range of $74-$86 from April 2025. Moreover, the consolidation seems to be coinciding with the trendline support and 0.618 retracement level at $78.35 of the price rise from $43.57 in August 2015 to $134.63 in June 2024. Further, the daily RSI is just above 60, indicating that a rebound may be near the corner.
Entry: Above $86
Targets: $94.92, $99.84, and $102.48.
Stop Loss: $78.35-$77.
Financial Performance
- Revenue Decline: Q2 revenue fell 2% year-over-year to $15.8 billion.
- Earnings Drop: Adjusted earnings per share decreased by 7% to $2.13.
Key Product Challenges
- Keytruda Competition: Facing increased competition for its top cancer drug, Keytruda.
- Patent Cliff: Keytruda’s patent expiration looms in 2028, posing a revenue risk.
Growth Highlights
- Winrevair Success: New pulmonary arterial hypertension drug generated $336 million in sales post-approval last year, with blockbuster potential.
- Animal Health Segment: Sales rose 11% year-over-year to $1.6 billion, showcasing strength in a leading segment.
Pipeline and Innovation
- Subcutaneous Keytruda: Aced phase 3 studies, extending patent protection.
- Pipeline Expansion: Enhanced through licensing agreements, including promising cancer and weight loss therapies.
- Innovation Potential: Likely to develop new therapies to offset Keytruda revenue risks.
Dividend Profile
- Forward Yield: Offers a 3.85% forward dividend yield.
- Dividend Growth: Increased dividends by 39% over the past five years.
- Investment Appeal: Remains attractive for dividend-seeking investors.
Technical Analysis
The stock price has fallen by over 45% from its ATH of $134.63 in June 2024. The price seems to be consolidating within the range of $74-$86 from April 2025. Moreover, the consolidation seems to be coinciding with the trendline support and 0.618 retracement level at $78.35 of the price rise from $43.57 in August 2015 to $134.63 in June 2024. Further, the daily RSI is just above 60, indicating that a rebound may be near the corner.
Entry: Above $86
Targets: $94.92, $99.84, and $102.48.
Stop Loss: $78.35-$77.
Penafian
The information and publications are not meant to be, and do not constitute, financial, investment, trading, or other types of advice or recommendations supplied or endorsed by TradingView. Read more in the Terms of Use.
Penafian
The information and publications are not meant to be, and do not constitute, financial, investment, trading, or other types of advice or recommendations supplied or endorsed by TradingView. Read more in the Terms of Use.