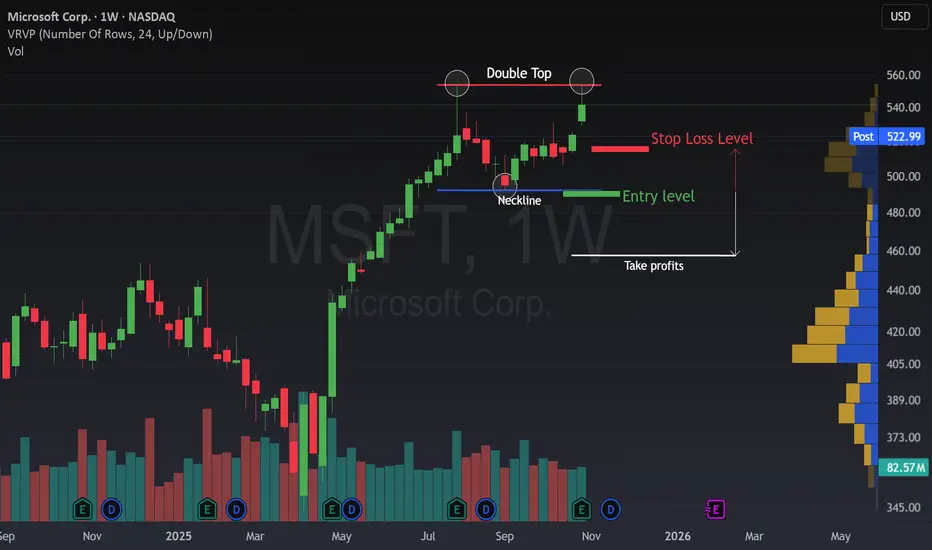
The weekly chart of Microsoft (MSFT) is showing a potential Double Top formation, a classic sign that bullish momentum might be losing strength.
🔹 Bullish Scenario: As long as the price stays above the blue neckline, the uptrend remains intact. Buyers are still in control, and a clear breakout above the recent highs could trigger a move into new all-time highs.
🔹 Bearish Scenario: If the price breaks below the neckline, it could confirm the Double Top setup and open the door for short opportunities.
 MSFT is standing at a critical decision point, will the stock continue its strong rally, or is this the first sign of exhaustion before a larger pullback?
💬 What do you think, are we about to see another breakout, or is the beginning of a deeper correction?
🔹 Bullish Scenario: As long as the price stays above the blue neckline, the uptrend remains intact. Buyers are still in control, and a clear breakout above the recent highs could trigger a move into new all-time highs.
🔹 Bearish Scenario: If the price breaks below the neckline, it could confirm the Double Top setup and open the door for short opportunities.
💬 What do you think, are we about to see another breakout, or is the beginning of a deeper correction?
Dagangan aktif
We are seeing a pullback after the clear break of the neckline. This is a new opportunity to short, but take care because MSFT is such an amazing bull stock!⚡ Trading is not about luck or patience. Is about skills and knowledge. ⚡
I share my ideas, returns and knowledge here:
📚 👉 topchartpatterns.substack.com/subscribe 👈📚
🤝 Business contact: info@topchartpatterns.com
I share my ideas, returns and knowledge here:
📚 👉 topchartpatterns.substack.com/subscribe 👈📚
🤝 Business contact: info@topchartpatterns.com
Penerbitan berkaitan
Penafian
Maklumat dan penerbitan adalah tidak bertujuan, dan tidak membentuk, nasihat atau cadangan kewangan, pelaburan, dagangan atau jenis lain yang diberikan atau disahkan oleh TradingView. Baca lebih dalam Terma Penggunaan.
⚡ Trading is not about luck or patience. Is about skills and knowledge. ⚡
I share my ideas, returns and knowledge here:
📚 👉 topchartpatterns.substack.com/subscribe 👈📚
🤝 Business contact: info@topchartpatterns.com
I share my ideas, returns and knowledge here:
📚 👉 topchartpatterns.substack.com/subscribe 👈📚
🤝 Business contact: info@topchartpatterns.com
Penerbitan berkaitan
Penafian
Maklumat dan penerbitan adalah tidak bertujuan, dan tidak membentuk, nasihat atau cadangan kewangan, pelaburan, dagangan atau jenis lain yang diberikan atau disahkan oleh TradingView. Baca lebih dalam Terma Penggunaan.