hi traders,
This analysis of the Microsoft ( MSFT) monthly chart identifies a bearish technical pattern that suggests a significant correction is imminent, likely forming a necessary higher low before the continuation of the macro bull market.
Key Technical Observations
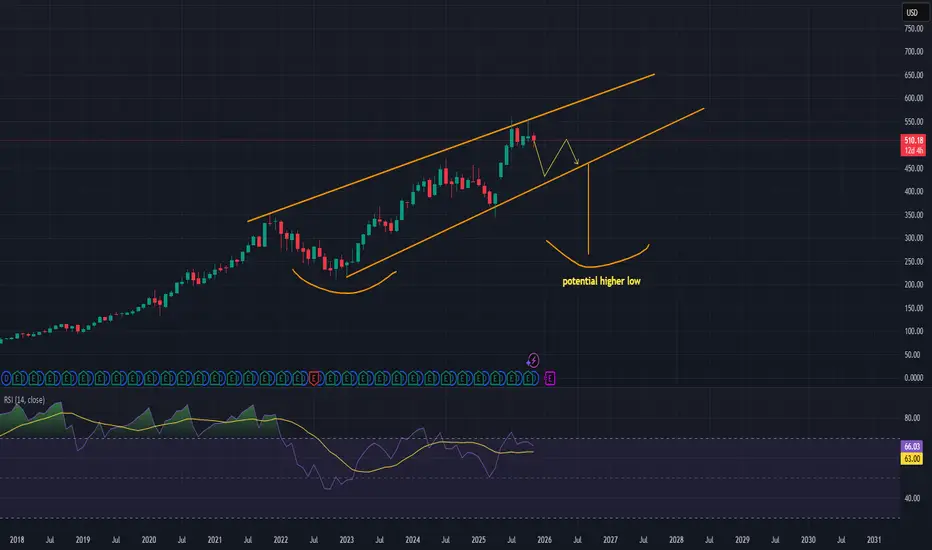
Rising Wedge Pattern: The price action over the last several years has formed a clear Rising Wedge pattern (marked by the two converging orange trendlines). This pattern is defined by a series of higher highs and higher lows, with the momentum decreasing as the price moves up and the trendlines narrow.
Interpretation: The Rising Wedge is a bearish reversal pattern. It typically resolves with a sharp break below the lower trendline. The recent move upward suggests the price is currently retesting the upper boundary of the wedge.
Momentum Check (RSI): The Relative Strength Index (RSI) is currently trending in the bullish zone (above 50.00), but it has recently turned down after failing to make strong new highs, indicating a loss of upward momentum. The current reading is 66.83, which still suggests some overbought condition relative to the previous range.
Projected Correction Path: The chart suggests the price will face resistance near the top of the wedge, leading to a breakdown below the current price level. The projected path (yellow arrows) targets a drop towards the lower trendline of the wedge.
Strategic Outlook: Forming the Macro Higher Low
The most important feature of this setup is the concept of the potential higher low (labeled on the chart).
Necessity of Correction: For any healthy, long-term bull market to continue, corrections are needed to reset indicators and shake out weaker hands.
The Higher Low: The projected support at the lower trendline is expected to form a Higher Low relative to the previous major swing low (the curved yellow line at the bottom of the wedge, seen around 2023).
Trade Idea: A break below the current level and a move towards the lower trendline would establish this higher low, completing the bearish phase of the pattern and providing a prime long-term accumulation zone for the next leg of the macro bull market.
Conclusion:
While the short-to-medium term outlook is bearish, targeting a move down to the lower boundary of the Rising Wedge, this correction is viewed as a necessary and healthy event. The key level to watch is the lower trendline, as its defense will confirm the creation of a macro higher low and signal the continuation of Microsoft's secular bull trend.
This analysis of the Microsoft (
Key Technical Observations
Rising Wedge Pattern: The price action over the last several years has formed a clear Rising Wedge pattern (marked by the two converging orange trendlines). This pattern is defined by a series of higher highs and higher lows, with the momentum decreasing as the price moves up and the trendlines narrow.
Interpretation: The Rising Wedge is a bearish reversal pattern. It typically resolves with a sharp break below the lower trendline. The recent move upward suggests the price is currently retesting the upper boundary of the wedge.
Momentum Check (RSI): The Relative Strength Index (RSI) is currently trending in the bullish zone (above 50.00), but it has recently turned down after failing to make strong new highs, indicating a loss of upward momentum. The current reading is 66.83, which still suggests some overbought condition relative to the previous range.
Projected Correction Path: The chart suggests the price will face resistance near the top of the wedge, leading to a breakdown below the current price level. The projected path (yellow arrows) targets a drop towards the lower trendline of the wedge.
Strategic Outlook: Forming the Macro Higher Low
The most important feature of this setup is the concept of the potential higher low (labeled on the chart).
Necessity of Correction: For any healthy, long-term bull market to continue, corrections are needed to reset indicators and shake out weaker hands.
The Higher Low: The projected support at the lower trendline is expected to form a Higher Low relative to the previous major swing low (the curved yellow line at the bottom of the wedge, seen around 2023).
Trade Idea: A break below the current level and a move towards the lower trendline would establish this higher low, completing the bearish phase of the pattern and providing a prime long-term accumulation zone for the next leg of the macro bull market.
Conclusion:
While the short-to-medium term outlook is bearish, targeting a move down to the lower boundary of the Rising Wedge, this correction is viewed as a necessary and healthy event. The key level to watch is the lower trendline, as its defense will confirm the creation of a macro higher low and signal the continuation of Microsoft's secular bull trend.
💥 Free signals and ideas ➡ t.me/vfinvestment
Penafian
The information and publications are not meant to be, and do not constitute, financial, investment, trading, or other types of advice or recommendations supplied or endorsed by TradingView. Read more in the Terms of Use.
💥 Free signals and ideas ➡ t.me/vfinvestment
Penafian
The information and publications are not meant to be, and do not constitute, financial, investment, trading, or other types of advice or recommendations supplied or endorsed by TradingView. Read more in the Terms of Use.