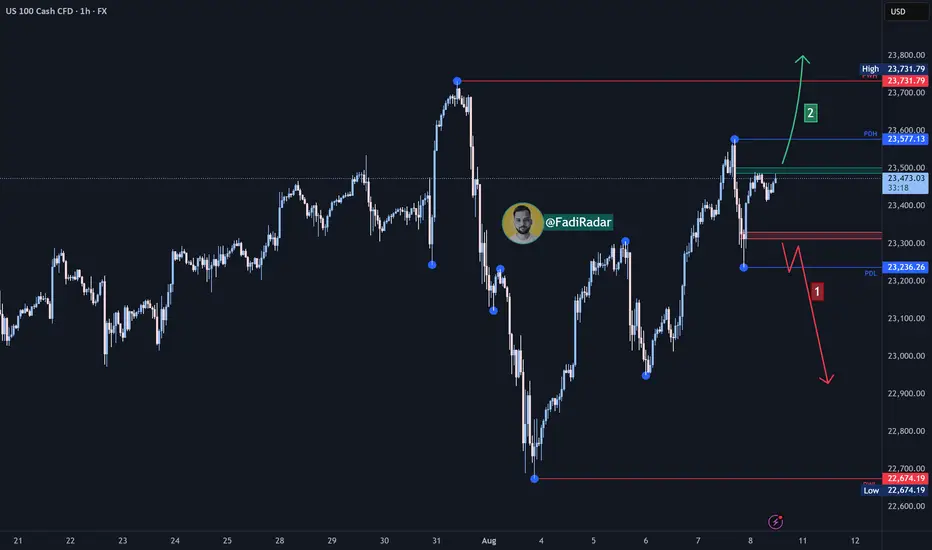
The NASDAQ index has shown strong bullish momentum recently and is currently trading near a key resistance level at $23,500.
🔻 Bearish Scenario:
If the price fails to break above $23,500 and selling pressure emerges, we could see a downward correction toward $23,310. A break below this level could extend the decline toward $23,000.
🔺 Bullish Scenario:
If the price successfully breaks and holds above $23,500, it could support further upside toward $23,600 as the first target. With continued bullish momentum, the price might reach $23,750.
⚠️ Disclaimer:
This analysis is not financial advice. It is recommended to monitor the markets and carefully analyze the data before making any investment decisions.
Penafian
Maklumat dan penerbitan adalah tidak dimaksudkan untuk menjadi, dan tidak membentuk, nasihat untuk kewangan, pelaburan, perdagangan dan jenis-jenis lain atau cadangan yang dibekalkan atau disahkan oleh TradingView. Baca dengan lebih lanjut di Terma Penggunaan.
Penafian
Maklumat dan penerbitan adalah tidak dimaksudkan untuk menjadi, dan tidak membentuk, nasihat untuk kewangan, pelaburan, perdagangan dan jenis-jenis lain atau cadangan yang dibekalkan atau disahkan oleh TradingView. Baca dengan lebih lanjut di Terma Penggunaan.
