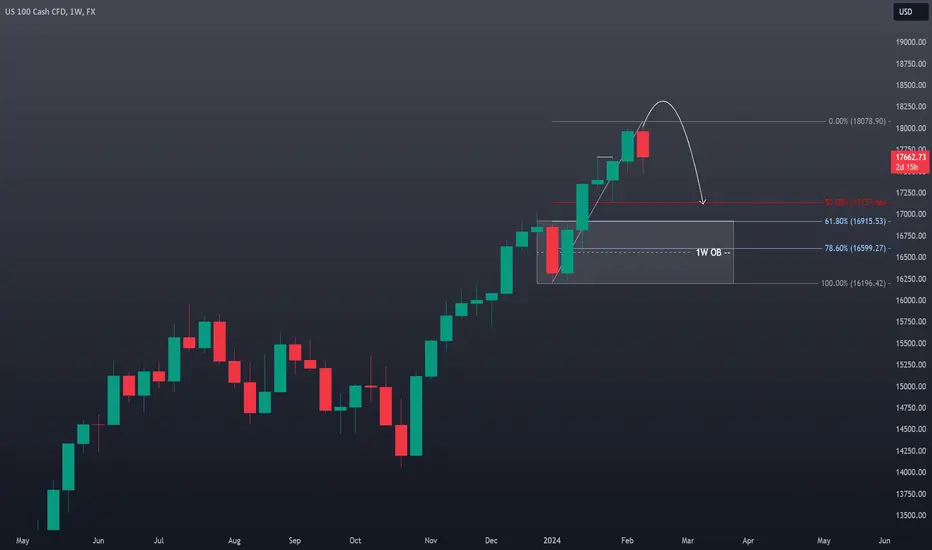
Market Observations: The #NAS100 has maintained a bullish trajectory. However, price action on the monthly timeframe suggest the #US100 is overextended. Additionally, the weekly chart reveals a double top pattern, hinting at a potential retracement down to the 50-61.8% Fibonacci levels. This area could provide the liquidity needed for major market players to fill long orders.
Trade Strategy: Consider an intraday/swing trade short entry following a potential stop run above the current range. Target an initial profit level around the previous lows near 17250, with a secondary target at 17000 (slightly above the 61.8% Fibonacci level on a 1W chart). Implement a well-placed stop-loss order to manage risk effectively.
Disclaimer: This analysis is based on my observations and does not constitute financial advice. Conduct your own independent research and carefully assess your risk tolerance before making investment decisions.
🚀 Winning Scalping Strategy To Beat Market Chaos: ✅ 🚀
👀 🔗 youtu.be/4aI23mzOLJE
🚀 Trade Signals For Your PROP FIRM CHALLENGE: 🔥💰
👀 🔗 youtu.be/nWD69sSxRUM
👉Join Our Free DISCORD:
🔗 discord.com/invite/PcBeCdwVQq
👀 🔗 youtu.be/4aI23mzOLJE
🚀 Trade Signals For Your PROP FIRM CHALLENGE: 🔥💰
👀 🔗 youtu.be/nWD69sSxRUM
👉Join Our Free DISCORD:
🔗 discord.com/invite/PcBeCdwVQq
Penafian
Maklumat dan penerbitan adalah tidak dimaksudkan untuk menjadi, dan tidak membentuk, nasihat untuk kewangan, pelaburan, perdagangan dan jenis-jenis lain atau cadangan yang dibekalkan atau disahkan oleh TradingView. Baca dengan lebih lanjut di Terma Penggunaan.