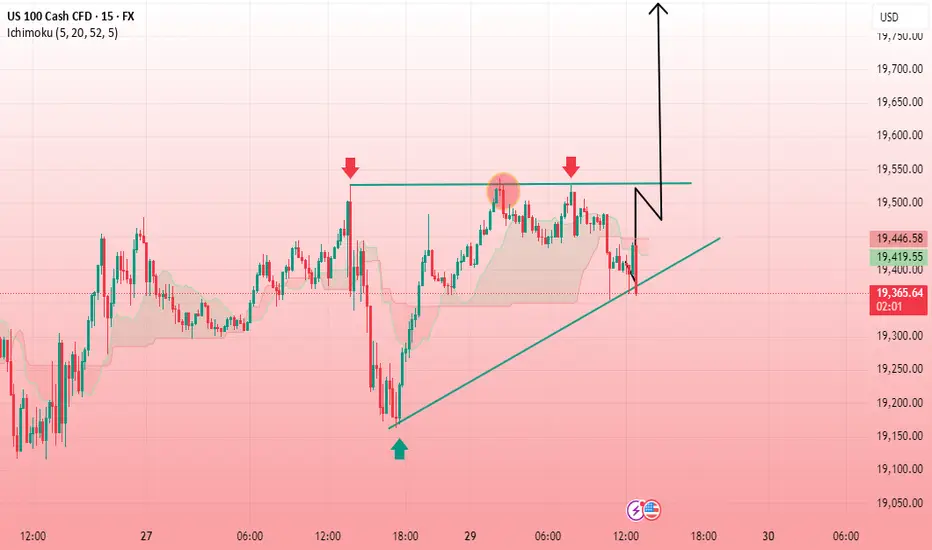
echnical Analysis Summary
Chart Pattern Observed:
The chart shows a clear ascending triangle pattern, which is a bullish continuation pattern. This is formed by a horizontal resistance level (around 19,550) and a rising trendline (higher lows), suggesting buying pressure is building up.
Key Levels:
Resistance Zone: 19,550
Support Trendline: Rising from ~19,050 to current level
Current Price: ~19,580
Breakout Target: 19,800.00 (as marked)
Interpretation:
Price has tested the 19,550 resistance multiple times without breaking lower significantly, indicating strength.
A breakout above this resistance would confirm the bullish triangle pattern.
The projected target, calculated using the height of the triangle added to the breakout level, is around 19,800.
Volume confirmation would further strengthen the breakout's validity (not shown here).
Potential Strategy:
Buy on breakout above 19,550, ideally with volume confirmation.
Take Profit: Around 19,800, per the measured move projection
Dagangan aktif
Trade active in buyDagangan ditutup: sasaran tercapai
Target (19,800) ReachedJoin telegram channel free ..
t.me/GoldMan0009
Forex, Gold & Crypto Signals with detailed analysis & get consistent results..
Gold Signal's with proper TP & SL for high profit opportunities..
t.me/GoldMan0009
t.me/GoldMan0009
Forex, Gold & Crypto Signals with detailed analysis & get consistent results..
Gold Signal's with proper TP & SL for high profit opportunities..
t.me/GoldMan0009
Penafian
Maklumat dan penerbitan adalah tidak dimaksudkan untuk menjadi, dan tidak membentuk, nasihat untuk kewangan, pelaburan, perdagangan dan jenis-jenis lain atau cadangan yang dibekalkan atau disahkan oleh TradingView. Baca dengan lebih lanjut di Terma Penggunaan.
Join telegram channel free ..
t.me/GoldMan0009
Forex, Gold & Crypto Signals with detailed analysis & get consistent results..
Gold Signal's with proper TP & SL for high profit opportunities..
t.me/GoldMan0009
t.me/GoldMan0009
Forex, Gold & Crypto Signals with detailed analysis & get consistent results..
Gold Signal's with proper TP & SL for high profit opportunities..
t.me/GoldMan0009
Penafian
Maklumat dan penerbitan adalah tidak dimaksudkan untuk menjadi, dan tidak membentuk, nasihat untuk kewangan, pelaburan, perdagangan dan jenis-jenis lain atau cadangan yang dibekalkan atau disahkan oleh TradingView. Baca dengan lebih lanjut di Terma Penggunaan.
