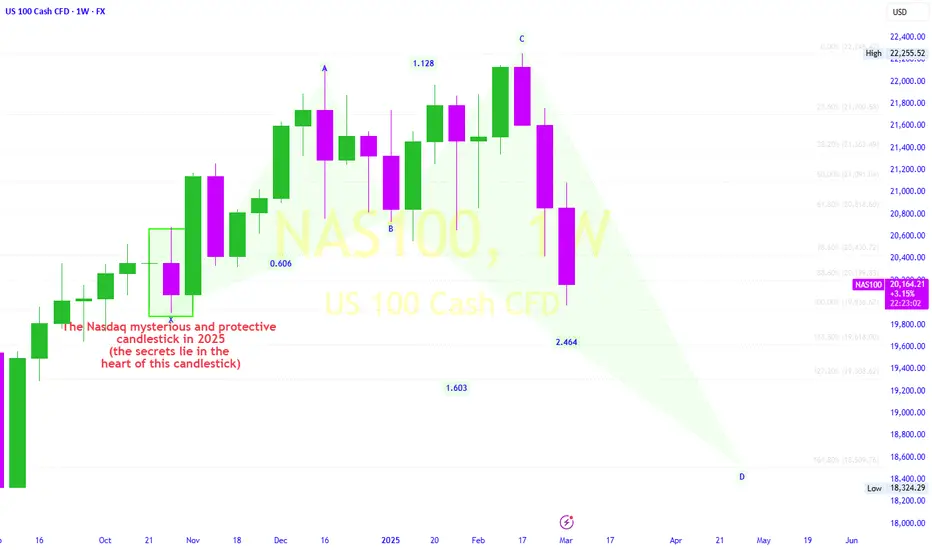
The NASDAQ , after peaking at an unprecedented 22,000 in 2024, has begun a corrective phase driven by pausing Federal Reserve interest rates, concerns over tech-sector profitability, and escalating geopolitical tensions and Trump Commands. This pullback reflects a shift away from growth stocks toward safer assets.
As outlined in this Chart, the index is now validating a bearish harmonic pattern (Crab), which typically signals major trend reversals.
The pattern’s completion zone aligns with key Fibonacci retracement levels (61.8–78.6%) of the 2022–2024 bull run, projecting downside targets:
Macro risks, such as prolonged restrictive monetary policy, slowing AI-driven earnings growth, and U.S.-China and US-Europe trade tensions, could accelerate this decline.
Traders are monitoring a decisive break below 20,500 with high volume to confirm bearish momentum, while a rebound from 18,500—coupled with reversal patterns like a double bottom may signal a short/mid-term buying opportunity.
This outlook hinges on earnings reports from mega-cap tech firms (Microsoft, Apple, NVIDIA) and Federal Reserve policy guidance.
As outlined in this Chart, the index is now validating a bearish harmonic pattern (Crab), which typically signals major trend reversals.
The pattern’s completion zone aligns with key Fibonacci retracement levels (61.8–78.6%) of the 2022–2024 bull run, projecting downside targets:
- - Near-term support: 20,000–20,500 (dynamic support near the 100-week moving average).
- - Intermediate zone: 19,000–19,500 (50% Fibonacci level and long-term trendline confluence).
- - Final target: 18,500 (78.6% Fibonacci retracement and psychological “golden support”).
Macro risks, such as prolonged restrictive monetary policy, slowing AI-driven earnings growth, and U.S.-China and US-Europe trade tensions, could accelerate this decline.
Traders are monitoring a decisive break below 20,500 with high volume to confirm bearish momentum, while a rebound from 18,500—coupled with reversal patterns like a double bottom may signal a short/mid-term buying opportunity.
This outlook hinges on earnings reports from mega-cap tech firms (Microsoft, Apple, NVIDIA) and Federal Reserve policy guidance.
Nota
NVDA Dagangan aktif
TP 18.3kDagangan ditutup: sasaran tercapai
This idea is based on harmonic patterns and candlestick formations at Fibonacci levels. The targets for this order change along the way, depending on the candlestick patterns.
Penafian
Maklumat dan penerbitan adalah tidak dimaksudkan untuk menjadi, dan tidak membentuk, nasihat untuk kewangan, pelaburan, perdagangan dan jenis-jenis lain atau cadangan yang dibekalkan atau disahkan oleh TradingView. Baca dengan lebih lanjut di Terma Penggunaan.