NASDAQ 100 (NAS100) Technical Analysis & Forecast
Current Price: 24,781.00 | Date: October 4, 2025, 12:54 AM UTC+4
📊 EXECUTIVE SUMMARY
The NASDAQ 100 is currently trading at 24,781.00, showing resilience near all-time highs. This comprehensive analysis integrates multiple technical frameworks to provide actionable insights for both intraday and swing traders navigating the tech-heavy index.
Key Takeaway: NAS100 exhibits a cautious bullish bias with critical support at 24,650 and resistance at 25,100. Traders should monitor for potential consolidation before the next directional move.
🔍 MULTI-TIMEFRAME TECHNICAL ANALYSIS
Monthly & Weekly Outlook (Swing Trading Perspective)
Long-term Trend Assessment:
Primary Trend: Bullish structure remains intact with higher highs and higher lows established since Q4 2024
Elliott Wave Count: The index appears to be in Wave 5 of a larger impulse structure from the 2022 lows, suggesting a mature bull cycle
Ichimoku Cloud (Weekly): Price trading above the cloud with Tenkan-sen (9-period) above Kijun-sen (26-period), confirming bullish momentum
Key Weekly Levels:
Major Resistance: 25,200 - 25,350 (psychological level and prior consolidation zone)
Major Support: 24,200 - 24,350 (former resistance turned support, 20-week EMA)
Critical Support: 23,500 (50-week EMA, must hold for bull trend continuation)
Gann Analysis:
Square of 9 calculation from recent lows suggests the next significant price target at 25,088 (45° angle)
Time cycle analysis indicates potential volatility window October 8-12, 2025
Price-time squaring suggests equilibrium at current levels, with break expected by mid-October
Daily Chart Analysis (Swing & Position Trading)
Trend & Momentum:
50-day SMA: 24,420 (acting as dynamic support)
200-day SMA: 23,680 (long-term trend anchor)
RSI (14): Currently at 64, showing bullish momentum without overbought conditions
MACD: Positive histogram with signal line above zero, indicating upward momentum
Chart Patterns Identified:
Ascending Triangle Formation: Consolidation between 24,650 support and 25,100 resistance suggests a bullish continuation pattern
Wyckoff Analysis: Signs of re-accumulation phase (Trading Range) after the spring rally, indicating smart money positioning
Harmonic Patterns:
Potential Bullish Bat pattern completing near 24,650, with PRZ (Potential Reversal Zone) offering strong support
Fibonacci retracement from recent swing shows 61.8% level at 24,580, aligning with multiple support factors
Volume Profile:
VWAP (Anchored from Sept 1): 24,695 - price maintaining above VWAP indicates institutional buying
Volume Analysis: Above-average volume on up days suggests strong bullish participation
High Volume Node (HVN): 24,750-24,800 represents fair value area
4-Hour Chart (Transitional Timeframe)
Technical Indicators:
Bollinger Bands: Price trading in upper band (24,950), suggesting near-term overbought conditions but strong trend
RSI (14): 68 - approaching overbought but no bearish divergence yet
Stochastic Oscillator: %K at 82, %D at 76 - overbought territory, watch for crossover
Ichimoku System:
Price above cloud (bullish)
Lagging span above price (confirming bullish sentiment)
Cloud ahead is thin, suggesting potential resistance at 25,050-25,100
Support & Resistance:
Immediate Resistance: 24,950 → 25,100 (psychological and technical confluence)
Immediate Support: 24,650 → 24,500 (previous consolidation and EMA cluster)
1-Hour Chart (Intraday Swing Reference)
Short-term Momentum:
20 EMA: 24,745
50 EMA: 24,680
100 EMA: 24,620
Price trading above all key EMAs indicates short-term bullish control
Candlestick Patterns:
Recent formation of bullish engulfing patterns on hourly suggests buying pressure
No immediate reversal patterns detected
Warning Signs:
Potential Bear Trap: If price briefly breaks below 24,650 with low volume, expect quick recovery (trap for shorts)
Bull Trap Risk: Break above 25,100 without volume confirmation could reverse quickly
📈 INTRADAY TRADING STRATEGY (Week of October 4-11, 2025)
15-Minute & 30-Minute Chart Focus
Monday-Tuesday Bias: Consolidation expected between 24,650-24,950
Long Entry Strategies:
Setup 1: Support Bounce Play
Entry Zone: 24,650-24,700
Stop Loss: 24,580 (below harmonic PRZ)
Target 1: 24,850 (Risk:Reward 1:2)
Target 2: 24,950 (Risk:Reward 1:3.5)
Confirmation: RSI (15-min) oversold below 30, bullish candlestick reversal pattern
Setup 2: Breakout Play
Entry: Break and retest of 24,950 with volume
Stop Loss: 24,870
Target 1: 25,050
Target 2: 25,150 (ascending triangle measured move)
Confirmation: Volume 20% above average, 15-min candle close above 24,950
Setup 3: VWAP Reversion
Entry: Price touches VWAP (currently ~24,695) from above on 5-min chart
Stop Loss: 24,650
Target: 24,800-24,850
Confirmation: Volume spike on touch, bullish divergence on 5-min RSI
Short Entry Strategies:
Setup 1: Resistance Rejection
Entry Zone: 25,050-25,100
Stop Loss: 25,150
Target 1: 24,850
Target 2: 24,700
Confirmation: Bearish engulfing or shooting star on 15-min chart, RSI divergence
Setup 2: Failed Breakout (Bull Trap)
Entry: Price breaks 25,100 but closes back below within 2 candles (15-min)
Stop Loss: 25,130
Target: 24,800
Confirmation: High volume on breakout but no follow-through
🎯 SWING TRADING STRATEGY (October-November 2025)
Bullish Scenario (60% Probability)
Primary Strategy: Ascending Triangle Breakout
Entry Plan:
Aggressive Entry: Current levels (24,780) with tight risk management
Conservative Entry: Pullback to 24,500-24,650 support zone
Breakout Entry: Confirmed break above 25,100 with volume
Position Sizing:
Risk 1-2% of capital per trade
Scale in: 50% at first entry, 30% on confirmation, 20% on continuation
Price Targets:
Target 1: 25,350 (measured move from triangle)
Target 2: 25,800 (Fibonacci extension 1.618)
Target 3: 26,200 (psychological and Gann Square of 9 target)
Stop Loss Management:
Initial Stop: Below 24,500
Trail Stop: Move to breakeven once Target 1 is reached
Final Stop: Trail with 4-hour 20 EMA
Time Horizon: 3-6 weeks
Bearish Scenario (40% Probability)
Invalidation Triggers:
Break below 24,500 on daily close
Head and Shoulders pattern develops (left shoulder at 25,200, head forming now, right shoulder anticipated)
MACD bearish crossover on daily chart
Short Strategy (Swing):
Entry Conditions:
Daily close below 24,500
RSI breaks below 50 on daily
Death cross forming (50 SMA crossing below 200 SMA - currently not present)
Targets:
Target 1: 24,200 (weekly support)
Target 2: 23,850 (50-day SMA)
Target 3: 23,500 (major support and 50-week EMA)
Stop Loss: Above 24,800
📉 RISK FACTORS & MARKET CONTEXT
Technical Risk Factors:
Overextension: Weekly RSI approaching 70 suggests limited upside without consolidation
Volume Divergence: If breakout occurs with declining volume, suspect false move
Elliott Wave: If in Wave 5, expect exhaustion and correction before new highs
External Market Considerations:
Macroeconomic Factors to Monitor:
Federal Reserve policy statements (October FOMC meeting expectations)
Q3 2025 earnings season for mega-cap tech (starting mid-October)
Geopolitical tensions and their impact on risk sentiment
US Dollar strength affecting multinational tech companies
Sector-Specific Catalysts:
AI technology developments and adoption rates
Semiconductor supply chain updates
Regulatory environment for big tech
Interest rate trajectory impacts on growth stocks
🛡️ RISK MANAGEMENT RULES
For All Trading Timeframes:
Position Sizing: Never risk more than 2% of capital on single trade
Stop Loss: Mandatory on every trade, no exceptions
Take Profits: Scale out at predetermined levels (50% at T1, 30% at T2, 20% at T3)
Maximum Daily Loss: Stop trading if down 4% in single day
Correlation Risk: NAS100 correlates with QQQ, SPX, and major tech stocks - monitor for divergences
Trading Journal Requirements:
Document all entries with screenshots
Record reasoning and technical setup
Track hit rate and average risk:reward
Weekly performance review and strategy adjustment
📅 WEEKLY INTRADAY ROADMAP
Monday, October 7:
Bias: Neutral to slightly bullish
Key Level: 24,750 (Friday's close area)
Strategy: Wait for direction after Asian/European session
Action: If holds above 24,700, look for longs on 15-min pullbacks
Tuesday, October 8:
Bias: Testing resistance at 24,950
Gann Time Cycle: Potential volatility day
Strategy: Breakout or rejection trades
Action: High-probability setups at extremes
Wednesday, October 9:
Bias: Continuation or reversal confirmation day
Strategy: Follow Tuesday's direction with momentum
Action: Trail stops on profitable positions
Thursday, October 10:
Bias: Mid-week profit-taking possible
Strategy: Mean reversion trades if overextended
Action: Watch for VWAP reversion setups
Friday, October 11:
Bias: Week-end positioning, reduced size
Strategy: Close most intraday positions before weekend
Action: Only high-conviction swing trades held over weekend
🎓 INDICATOR CONFLUENCE SUMMARY
Bullish Signals (Current):
✅ Price above 50-day, 100-day, and 200-day SMAs
✅ Ichimoku cloud bullish on daily and weekly
✅ MACD positive on multiple timeframes
✅ Volume profile shows accumulation
✅ Ascending triangle continuation pattern
✅ Gann angles supporting upward trajectory
Bearish Warnings:
⚠️ RSI approaching overbought on 4-hour
⚠️ Potential Elliott Wave 5 exhaustion
⚠️ Bollinger Bands showing overextension
⚠️ Stochastic overbought on shorter timeframes
Neutral/Watch:
🔍 Volume needs to increase on breakout attempts
🔍 Wyckoff accumulation phase requires confirmation
🔍 Head and Shoulders pattern could develop if resistance holds
🎯 FINAL TRADING RECOMMENDATIONS
For Intraday Traders:
Focus on the 24,650-25,100 range for the next week. Best opportunities exist at range extremes with clear risk management. Favor long setups given the broader bullish context, but remain nimble and respect stop losses.
Best Intraday Timeframes: 5-min for entries, 15-min for trend confirmation, 1-hour for bias
For Swing Traders:
The ascending triangle offers an excellent risk:reward setup. Consider building positions on pullbacks to 24,500-24,650 with stops below 24,450. Target the 25,350-25,800 zone over the next 4-6 weeks. Monitor daily candle closes for trend confirmation.
Best Swing Timeframes: Daily for entries, 4-hour for momentum, weekly for trend validation
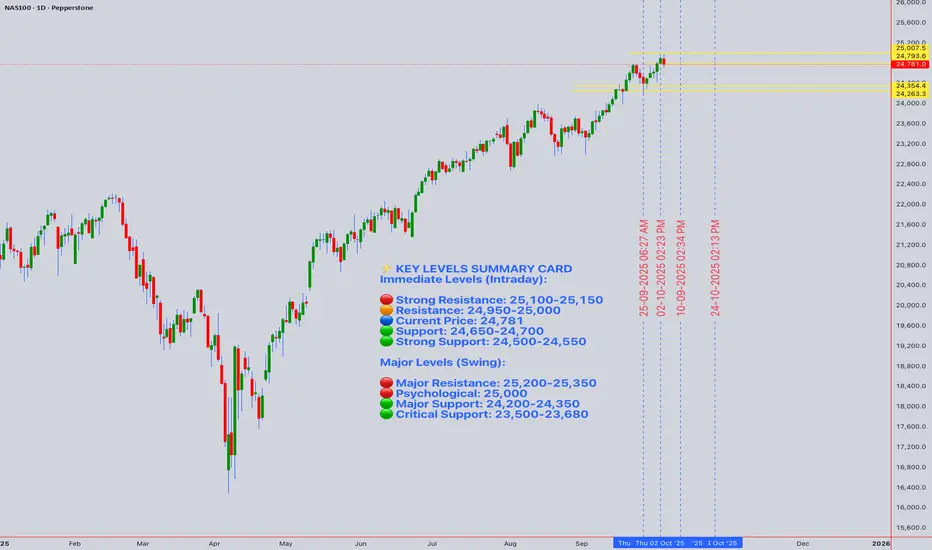
⚡ KEY LEVELS SUMMARY CARD
Immediate Levels (Intraday):
🔴 Strong Resistance: 25,100-25,150
🟠 Resistance: 24,950-25,000
🔵 Current Price: 24,781
🟢 Support: 24,650-24,700
🟢 Strong Support: 24,500-24,550
Major Levels (Swing):
🔴 Major Resistance: 25,200-25,350
🔴 Psychological: 25,000
🟢 Major Support: 24,200-24,350
🟢 Critical Support: 23,500-23,680
📝 DISCLAIMER
This analysis is for educational and informational purposes only. Trading financial instruments carries substantial risk and may not be suitable for all investors. Past performance does not guarantee future results. Always conduct your own research and consult with licensed financial advisors before making trading decisions. The author is not responsible for any trading losses incurred based on this analysis.
Next Update: October 11, 2025
Analysis Valid Through: October 18, 2025
Prepared using advanced technical analysis incorporating Wyckoff, Elliott Wave, Gann, Harmonic Patterns, Ichimoku, and modern momentum indicators.RetryClaude can make mistakes. Please double-check responses.
Current Price: 24,781.00 | Date: October 4, 2025, 12:54 AM UTC+4
📊 EXECUTIVE SUMMARY
The NASDAQ 100 is currently trading at 24,781.00, showing resilience near all-time highs. This comprehensive analysis integrates multiple technical frameworks to provide actionable insights for both intraday and swing traders navigating the tech-heavy index.
Key Takeaway: NAS100 exhibits a cautious bullish bias with critical support at 24,650 and resistance at 25,100. Traders should monitor for potential consolidation before the next directional move.
🔍 MULTI-TIMEFRAME TECHNICAL ANALYSIS
Monthly & Weekly Outlook (Swing Trading Perspective)
Long-term Trend Assessment:
Primary Trend: Bullish structure remains intact with higher highs and higher lows established since Q4 2024
Elliott Wave Count: The index appears to be in Wave 5 of a larger impulse structure from the 2022 lows, suggesting a mature bull cycle
Ichimoku Cloud (Weekly): Price trading above the cloud with Tenkan-sen (9-period) above Kijun-sen (26-period), confirming bullish momentum
Key Weekly Levels:
Major Resistance: 25,200 - 25,350 (psychological level and prior consolidation zone)
Major Support: 24,200 - 24,350 (former resistance turned support, 20-week EMA)
Critical Support: 23,500 (50-week EMA, must hold for bull trend continuation)
Gann Analysis:
Square of 9 calculation from recent lows suggests the next significant price target at 25,088 (45° angle)
Time cycle analysis indicates potential volatility window October 8-12, 2025
Price-time squaring suggests equilibrium at current levels, with break expected by mid-October
Daily Chart Analysis (Swing & Position Trading)
Trend & Momentum:
50-day SMA: 24,420 (acting as dynamic support)
200-day SMA: 23,680 (long-term trend anchor)
RSI (14): Currently at 64, showing bullish momentum without overbought conditions
MACD: Positive histogram with signal line above zero, indicating upward momentum
Chart Patterns Identified:
Ascending Triangle Formation: Consolidation between 24,650 support and 25,100 resistance suggests a bullish continuation pattern
Wyckoff Analysis: Signs of re-accumulation phase (Trading Range) after the spring rally, indicating smart money positioning
Harmonic Patterns:
Potential Bullish Bat pattern completing near 24,650, with PRZ (Potential Reversal Zone) offering strong support
Fibonacci retracement from recent swing shows 61.8% level at 24,580, aligning with multiple support factors
Volume Profile:
VWAP (Anchored from Sept 1): 24,695 - price maintaining above VWAP indicates institutional buying
Volume Analysis: Above-average volume on up days suggests strong bullish participation
High Volume Node (HVN): 24,750-24,800 represents fair value area
4-Hour Chart (Transitional Timeframe)
Technical Indicators:
Bollinger Bands: Price trading in upper band (24,950), suggesting near-term overbought conditions but strong trend
RSI (14): 68 - approaching overbought but no bearish divergence yet
Stochastic Oscillator: %K at 82, %D at 76 - overbought territory, watch for crossover
Ichimoku System:
Price above cloud (bullish)
Lagging span above price (confirming bullish sentiment)
Cloud ahead is thin, suggesting potential resistance at 25,050-25,100
Support & Resistance:
Immediate Resistance: 24,950 → 25,100 (psychological and technical confluence)
Immediate Support: 24,650 → 24,500 (previous consolidation and EMA cluster)
1-Hour Chart (Intraday Swing Reference)
Short-term Momentum:
20 EMA: 24,745
50 EMA: 24,680
100 EMA: 24,620
Price trading above all key EMAs indicates short-term bullish control
Candlestick Patterns:
Recent formation of bullish engulfing patterns on hourly suggests buying pressure
No immediate reversal patterns detected
Warning Signs:
Potential Bear Trap: If price briefly breaks below 24,650 with low volume, expect quick recovery (trap for shorts)
Bull Trap Risk: Break above 25,100 without volume confirmation could reverse quickly
📈 INTRADAY TRADING STRATEGY (Week of October 4-11, 2025)
15-Minute & 30-Minute Chart Focus
Monday-Tuesday Bias: Consolidation expected between 24,650-24,950
Long Entry Strategies:
Setup 1: Support Bounce Play
Entry Zone: 24,650-24,700
Stop Loss: 24,580 (below harmonic PRZ)
Target 1: 24,850 (Risk:Reward 1:2)
Target 2: 24,950 (Risk:Reward 1:3.5)
Confirmation: RSI (15-min) oversold below 30, bullish candlestick reversal pattern
Setup 2: Breakout Play
Entry: Break and retest of 24,950 with volume
Stop Loss: 24,870
Target 1: 25,050
Target 2: 25,150 (ascending triangle measured move)
Confirmation: Volume 20% above average, 15-min candle close above 24,950
Setup 3: VWAP Reversion
Entry: Price touches VWAP (currently ~24,695) from above on 5-min chart
Stop Loss: 24,650
Target: 24,800-24,850
Confirmation: Volume spike on touch, bullish divergence on 5-min RSI
Short Entry Strategies:
Setup 1: Resistance Rejection
Entry Zone: 25,050-25,100
Stop Loss: 25,150
Target 1: 24,850
Target 2: 24,700
Confirmation: Bearish engulfing or shooting star on 15-min chart, RSI divergence
Setup 2: Failed Breakout (Bull Trap)
Entry: Price breaks 25,100 but closes back below within 2 candles (15-min)
Stop Loss: 25,130
Target: 24,800
Confirmation: High volume on breakout but no follow-through
🎯 SWING TRADING STRATEGY (October-November 2025)
Bullish Scenario (60% Probability)
Primary Strategy: Ascending Triangle Breakout
Entry Plan:
Aggressive Entry: Current levels (24,780) with tight risk management
Conservative Entry: Pullback to 24,500-24,650 support zone
Breakout Entry: Confirmed break above 25,100 with volume
Position Sizing:
Risk 1-2% of capital per trade
Scale in: 50% at first entry, 30% on confirmation, 20% on continuation
Price Targets:
Target 1: 25,350 (measured move from triangle)
Target 2: 25,800 (Fibonacci extension 1.618)
Target 3: 26,200 (psychological and Gann Square of 9 target)
Stop Loss Management:
Initial Stop: Below 24,500
Trail Stop: Move to breakeven once Target 1 is reached
Final Stop: Trail with 4-hour 20 EMA
Time Horizon: 3-6 weeks
Bearish Scenario (40% Probability)
Invalidation Triggers:
Break below 24,500 on daily close
Head and Shoulders pattern develops (left shoulder at 25,200, head forming now, right shoulder anticipated)
MACD bearish crossover on daily chart
Short Strategy (Swing):
Entry Conditions:
Daily close below 24,500
RSI breaks below 50 on daily
Death cross forming (50 SMA crossing below 200 SMA - currently not present)
Targets:
Target 1: 24,200 (weekly support)
Target 2: 23,850 (50-day SMA)
Target 3: 23,500 (major support and 50-week EMA)
Stop Loss: Above 24,800
📉 RISK FACTORS & MARKET CONTEXT
Technical Risk Factors:
Overextension: Weekly RSI approaching 70 suggests limited upside without consolidation
Volume Divergence: If breakout occurs with declining volume, suspect false move
Elliott Wave: If in Wave 5, expect exhaustion and correction before new highs
External Market Considerations:
Macroeconomic Factors to Monitor:
Federal Reserve policy statements (October FOMC meeting expectations)
Q3 2025 earnings season for mega-cap tech (starting mid-October)
Geopolitical tensions and their impact on risk sentiment
US Dollar strength affecting multinational tech companies
Sector-Specific Catalysts:
AI technology developments and adoption rates
Semiconductor supply chain updates
Regulatory environment for big tech
Interest rate trajectory impacts on growth stocks
🛡️ RISK MANAGEMENT RULES
For All Trading Timeframes:
Position Sizing: Never risk more than 2% of capital on single trade
Stop Loss: Mandatory on every trade, no exceptions
Take Profits: Scale out at predetermined levels (50% at T1, 30% at T2, 20% at T3)
Maximum Daily Loss: Stop trading if down 4% in single day
Correlation Risk: NAS100 correlates with QQQ, SPX, and major tech stocks - monitor for divergences
Trading Journal Requirements:
Document all entries with screenshots
Record reasoning and technical setup
Track hit rate and average risk:reward
Weekly performance review and strategy adjustment
📅 WEEKLY INTRADAY ROADMAP
Monday, October 7:
Bias: Neutral to slightly bullish
Key Level: 24,750 (Friday's close area)
Strategy: Wait for direction after Asian/European session
Action: If holds above 24,700, look for longs on 15-min pullbacks
Tuesday, October 8:
Bias: Testing resistance at 24,950
Gann Time Cycle: Potential volatility day
Strategy: Breakout or rejection trades
Action: High-probability setups at extremes
Wednesday, October 9:
Bias: Continuation or reversal confirmation day
Strategy: Follow Tuesday's direction with momentum
Action: Trail stops on profitable positions
Thursday, October 10:
Bias: Mid-week profit-taking possible
Strategy: Mean reversion trades if overextended
Action: Watch for VWAP reversion setups
Friday, October 11:
Bias: Week-end positioning, reduced size
Strategy: Close most intraday positions before weekend
Action: Only high-conviction swing trades held over weekend
🎓 INDICATOR CONFLUENCE SUMMARY
Bullish Signals (Current):
✅ Price above 50-day, 100-day, and 200-day SMAs
✅ Ichimoku cloud bullish on daily and weekly
✅ MACD positive on multiple timeframes
✅ Volume profile shows accumulation
✅ Ascending triangle continuation pattern
✅ Gann angles supporting upward trajectory
Bearish Warnings:
⚠️ RSI approaching overbought on 4-hour
⚠️ Potential Elliott Wave 5 exhaustion
⚠️ Bollinger Bands showing overextension
⚠️ Stochastic overbought on shorter timeframes
Neutral/Watch:
🔍 Volume needs to increase on breakout attempts
🔍 Wyckoff accumulation phase requires confirmation
🔍 Head and Shoulders pattern could develop if resistance holds
🎯 FINAL TRADING RECOMMENDATIONS
For Intraday Traders:
Focus on the 24,650-25,100 range for the next week. Best opportunities exist at range extremes with clear risk management. Favor long setups given the broader bullish context, but remain nimble and respect stop losses.
Best Intraday Timeframes: 5-min for entries, 15-min for trend confirmation, 1-hour for bias
For Swing Traders:
The ascending triangle offers an excellent risk:reward setup. Consider building positions on pullbacks to 24,500-24,650 with stops below 24,450. Target the 25,350-25,800 zone over the next 4-6 weeks. Monitor daily candle closes for trend confirmation.
Best Swing Timeframes: Daily for entries, 4-hour for momentum, weekly for trend validation
⚡ KEY LEVELS SUMMARY CARD
Immediate Levels (Intraday):
🔴 Strong Resistance: 25,100-25,150
🟠 Resistance: 24,950-25,000
🔵 Current Price: 24,781
🟢 Support: 24,650-24,700
🟢 Strong Support: 24,500-24,550
Major Levels (Swing):
🔴 Major Resistance: 25,200-25,350
🔴 Psychological: 25,000
🟢 Major Support: 24,200-24,350
🟢 Critical Support: 23,500-23,680
📝 DISCLAIMER
This analysis is for educational and informational purposes only. Trading financial instruments carries substantial risk and may not be suitable for all investors. Past performance does not guarantee future results. Always conduct your own research and consult with licensed financial advisors before making trading decisions. The author is not responsible for any trading losses incurred based on this analysis.
Next Update: October 11, 2025
Analysis Valid Through: October 18, 2025
Prepared using advanced technical analysis incorporating Wyckoff, Elliott Wave, Gann, Harmonic Patterns, Ichimoku, and modern momentum indicators.RetryClaude can make mistakes. Please double-check responses.
I am nothing @shunya.trade
Penafian
The information and publications are not meant to be, and do not constitute, financial, investment, trading, or other types of advice or recommendations supplied or endorsed by TradingView. Read more in the Terms of Use.
I am nothing @shunya.trade
Penafian
The information and publications are not meant to be, and do not constitute, financial, investment, trading, or other types of advice or recommendations supplied or endorsed by TradingView. Read more in the Terms of Use.