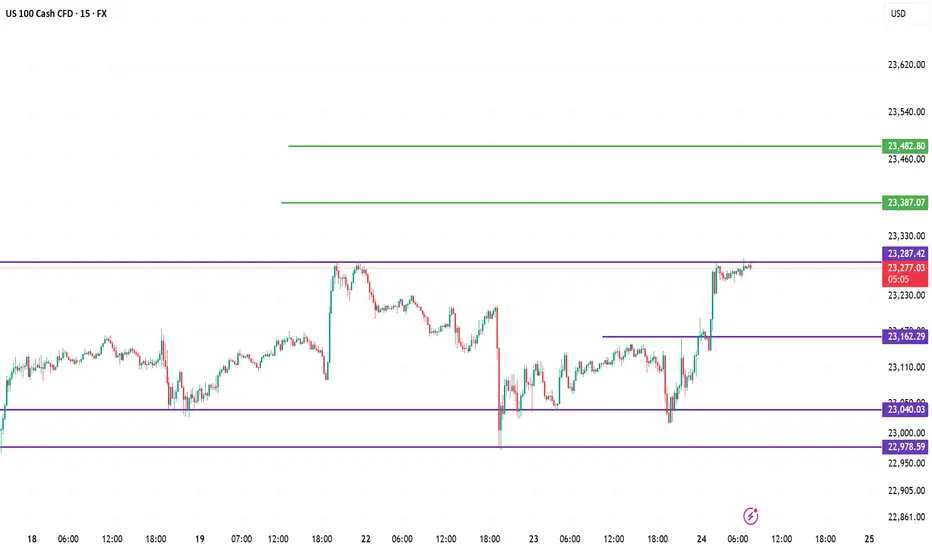
1. 🔍 Liquidity Grab (Sell-side taken)
Price swept below 23,040 and sharply reversed from 22,978, clearing out weak sellers.
2. 📈 Break of Structure (BOS)
A bullish BOS occurred after price broke above 23,162, confirming short-term bullish intent.
3. 🟪 Rejection Zone
Price is now testing 23,287.42 — a supply/resistance zone. Watch for signs of rejection or breakout.
4. 📊 Bullish Scenario
If price breaks 23,287 cleanly, expect next moves towards 23,387 and then 23,482.
5. 📉 Bearish Setup Possibility
Rejection from 23,287 could pull price back to 23,162 or 23,040 before the next move.
Here is my Telegram channel user name you can Join for Free Analysis and signals t.me/XAUTraderSidS
Penafian
Maklumat dan penerbitan adalah tidak dimaksudkan untuk menjadi, dan tidak membentuk, nasihat untuk kewangan, pelaburan, perdagangan dan jenis-jenis lain atau cadangan yang dibekalkan atau disahkan oleh TradingView. Baca dengan lebih lanjut di Terma Penggunaan.