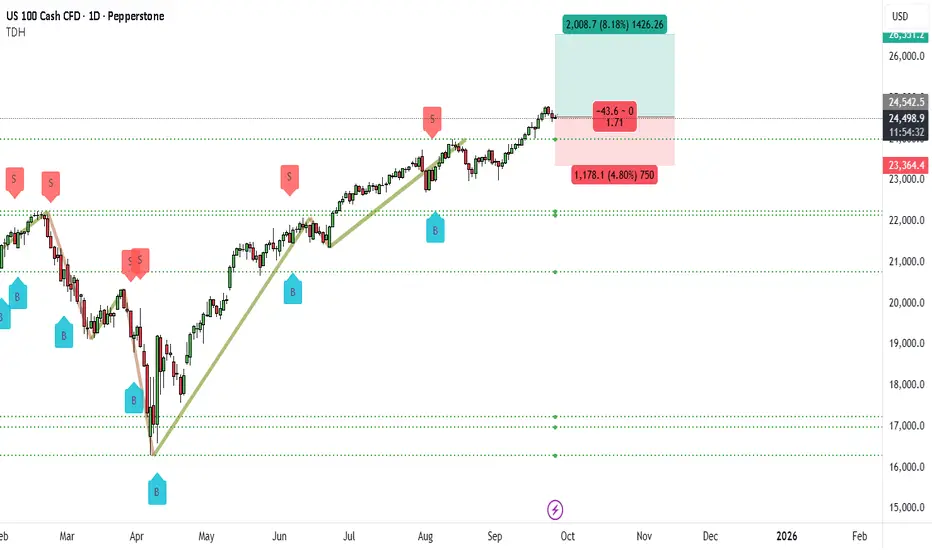
The US100 (NASDAQ) daily chart shows a very strong bullish structure. Since April, the index has been in a steady uptrend, creating higher highs and higher lows. Recently, price broke through the important 24,000 zone and is now consolidating just under 24,542. This consolidation at the highs is a healthy sign of strength, suggesting buyers are preparing for the next leg up.
The zone between 24,000 and 24,200 is now a major support base. As long as the market holds above this region, the bullish outlook remains intact. The next major target sits near 26,551, which lines up with an 8% projected upside move. Momentum remains with the bulls, and dips toward support are likely to be bought up quickly.
📌 Trade Setup (Bullish)
• Entry: 24,500 (current market or on breakout above 24,542)
• Stop-Loss: 23,364
• Take-Profit: 26,551
• Risk/Reward: ~1:1.7
Trade forex, indices, stocks and metals with up to US$100.000 in company's funding.
Complete a challenge to access funding or go for instant deposit.
Trading involves substantial risk. Not financial advice
Complete a challenge to access funding or go for instant deposit.
Trading involves substantial risk. Not financial advice
Penerbitan berkaitan
Penafian
Maklumat dan penerbitan adalah tidak dimaksudkan untuk menjadi, dan tidak membentuk, nasihat untuk kewangan, pelaburan, perdagangan dan jenis-jenis lain atau cadangan yang dibekalkan atau disahkan oleh TradingView. Baca dengan lebih lanjut di Terma Penggunaan.