When the Market Yawns at a Breakdown — It’s Time to Look?
Bullish Positional Setup Emerging
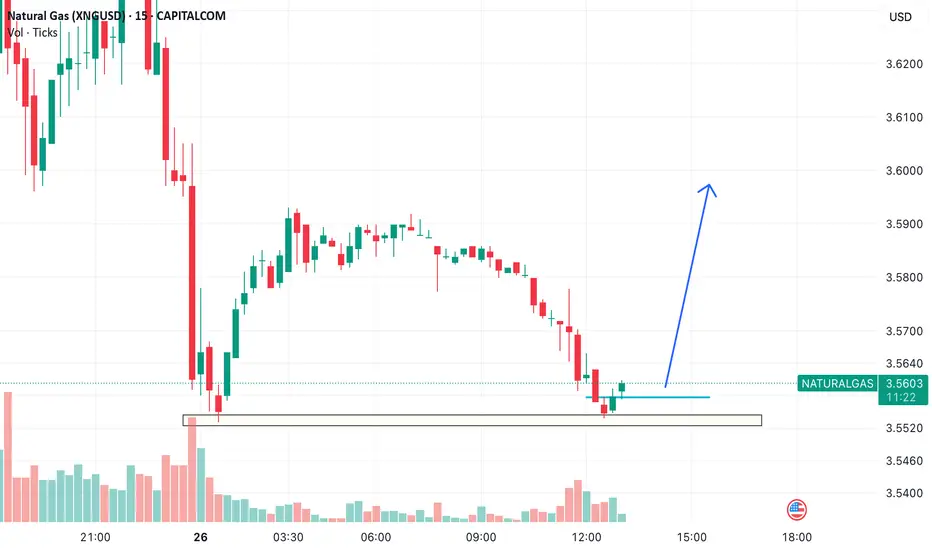
Despite relentless downward pressure, Natural Gas has landed into a previous demand pocket, holding the lows with surgical precision. A textbook case of seller exhaustion paired with invisible buying interest is unfolding on the 15-minute chart.
⸻
Structure Observation:
• Rejection from Key Demand Zone: The $3.55–$3.545 range has been tested twice and is being defended with volume.
• Volume Divergence: Notice the increasing red bars met with dry-up in follow-through selling — indicating distribution is likely over.
• Liquidity Sweep Setup: We’ve likely witnessed a liquidity grab under the prior support zone, shaking out weak hands before a move higher.
• Tight Accumulation: Price is stabilizing in a tight band — a typical precursor to vertical expansion if sustained above $3.56.
• Micro Timeframe Reversal: Subtle shift in market character. From lower highs/lows to possible higher low confirmation here.
⸻
The Trade – Stealthy Long
• Entry Zone: $3.56–$3.565 (as price reclaims structure)
• Stop Loss: Below $3.542 (just under demand)
• Target 1: $3.60 (supply shelf)
• Target 2: $3.625–$3.63 (gap-fill zone + fib confluence)
• Risk-Reward: ~1:2.5 to 1:3 — excellent reward-to-risk if the zone holds
⸻
This is the kind of setup where the market doesn’t scream; it whispers. The price doesn’t need to show fireworks — it just needs to stop bleeding, consolidate, and start climbing while everyone’s looking elsewhere. If this isn’t smart money accumulation, it’s doing a very good job pretending to be.
This is not about catching the bottom. It’s about understanding when the odds shift quietly in your favor.
⸻
Let it play out.
Let others react late.
You just needed to observe — and position early.
Dagangan ditutup: sasaran tercapai
Penafian
The information and publications are not meant to be, and do not constitute, financial, investment, trading, or other types of advice or recommendations supplied or endorsed by TradingView. Read more in the Terms of Use.
Penafian
The information and publications are not meant to be, and do not constitute, financial, investment, trading, or other types of advice or recommendations supplied or endorsed by TradingView. Read more in the Terms of Use.