Natural Gas
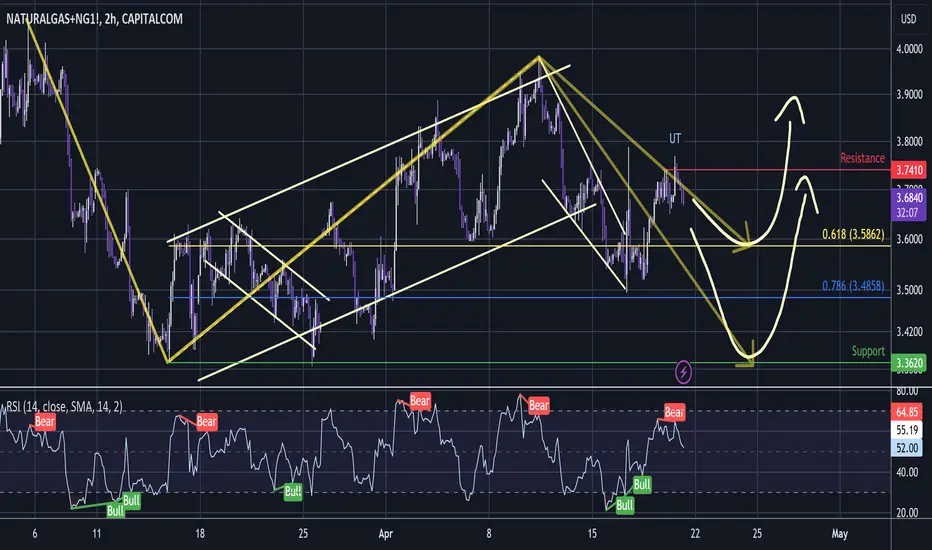
Now showing bearish divergence on the 3 hour chart after a higher high shakeout.
That is very likely to be a Wyckoff UT UpThrust.
This signals that the current wave up is now more likely to be a connective wave and there will be another bearish wave to follow.
Perhaps it gets back to somewhere around the 0.618 are perhaps it will get all the way back to the previous support low @$3.362 and that would complete a flat pattern.
Both are probably about equal odds and we'll need to see more.
I have taken some profit in this area but will hold a small amount through the area for long term👍.
Not advice
Your FA guru can't read a chart💭
I run a technical group with lots of content every day + regular videos, 1:1, chatroom 🚀.
Better than all the rest? My record speaks for itself 💡.
Telegram Group: $50 per month✨.
Contact: t.me/dRends35
I run a technical group with lots of content every day + regular videos, 1:1, chatroom 🚀.
Better than all the rest? My record speaks for itself 💡.
Telegram Group: $50 per month✨.
Contact: t.me/dRends35
Penafian
Maklumat dan penerbitan adalah tidak dimaksudkan untuk menjadi, dan tidak membentuk, nasihat untuk kewangan, pelaburan, perdagangan dan jenis-jenis lain atau cadangan yang dibekalkan atau disahkan oleh TradingView. Baca dengan lebih lanjut di Terma Penggunaan.