Singkat
NCASH/BTC Daily (Ascending Triangle)
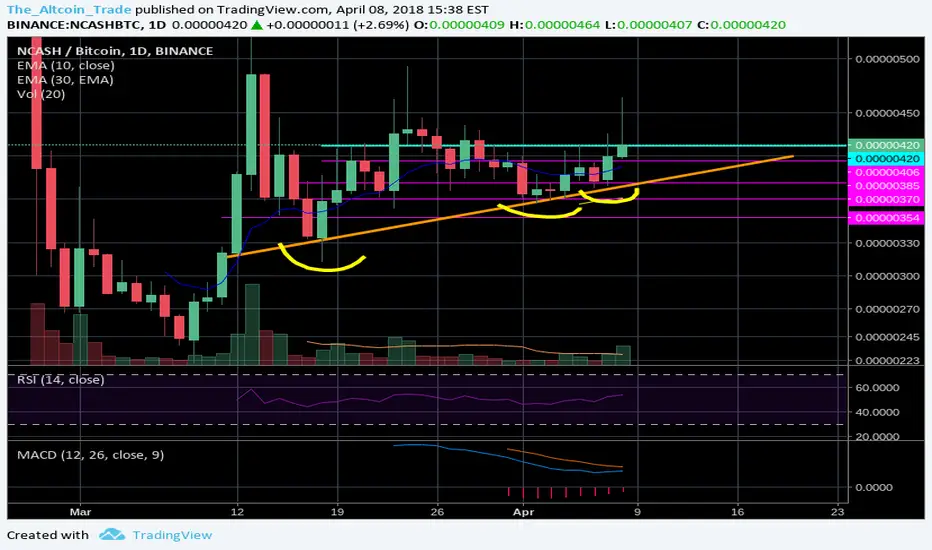
Daily Chart looks to be tightening up.
420 sats is that former resistance/now support level where the price keeps dropping to after pushing past it a few weeks ago.
That being said, higher low's are being formed. I expect a move within the next week to the upside.
420 sats is that former resistance/now support level where the price keeps dropping to after pushing past it a few weeks ago.
That being said, higher low's are being formed. I expect a move within the next week to the upside.
Nota
The 4hr Chart has the candle bouncing off of the 30 EMA. Keep eyes on the volume.Penafian
Maklumat dan penerbitan adalah tidak dimaksudkan untuk menjadi, dan tidak membentuk, nasihat untuk kewangan, pelaburan, perdagangan dan jenis-jenis lain atau cadangan yang dibekalkan atau disahkan oleh TradingView. Baca dengan lebih lanjut di Terma Penggunaan.
Penafian
Maklumat dan penerbitan adalah tidak dimaksudkan untuk menjadi, dan tidak membentuk, nasihat untuk kewangan, pelaburan, perdagangan dan jenis-jenis lain atau cadangan yang dibekalkan atau disahkan oleh TradingView. Baca dengan lebih lanjut di Terma Penggunaan.