🔍 Price Structure & Pattern Formation
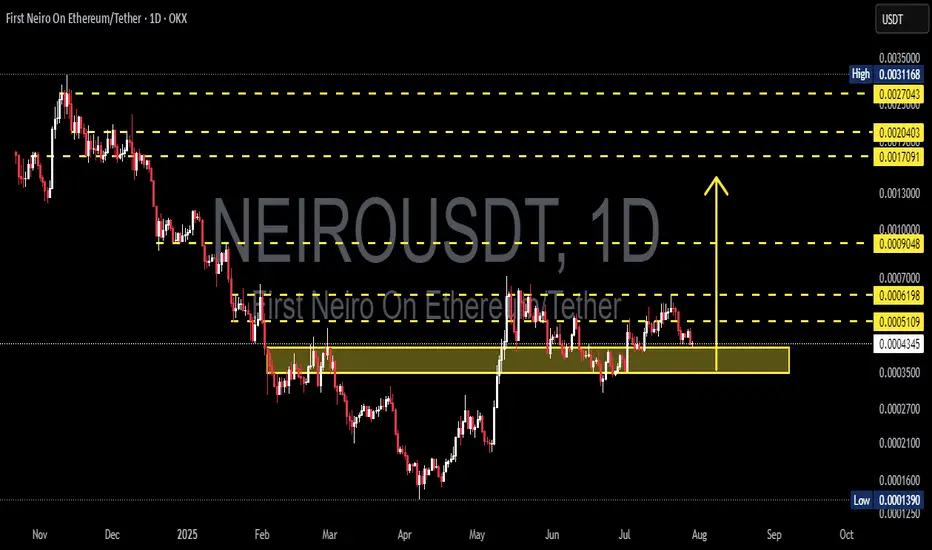
On the daily chart, NEIROUSDT is currently testing a major demand zone (highlighted in yellow) between 0.0004337 – 0.0003500 USDT. This area previously acted as a strong accumulation zone back in May and is now being retested as key support.
Price has entered a consolidation range after a short-term rally from April to May 2025.
Strong Support: 0.0004337 – 0.0003500
Nearest Resistance Levels: 0.0005109, 0.0006198
---
📈 Bullish Scenario
If the price holds above the demand zone and forms a valid bullish reversal pattern (e.g., bullish engulfing, pin bar), then a bullish move could follow.
Upside Targets (Resistance Levels):
1. 0.0005109
2. 0.0006198
3. 0.0009048
4. 0.0017091 (extended target)
5. 0.0020403
6. 0.0027043 (mid/long-term target)
Bullish Confirmation:
Daily close above 0.0006198
Increasing volume on bounce
Bullish candlestick formation in demand zone
---
📉 Bearish Scenario
If the price breaks below 0.0004337 and closes the day under it, it would indicate further downside potential.
Downside Targets (Support Levels):
1. 0.0003500 (bottom of demand zone)
2. 0.0002700
3. 0.0001600
4. 0.0001390 (previous major low)
Bearish Confirmation:
Strong daily close below 0.0004337
Retest of the zone fails as resistance
Bearish volume spikes
---
📐 Price Patterns
Potential Double Bottom: A bounce from this zone may form a double bottom pattern, with the neckline near 0.0006198.
Sideways Range / Accumulation: Price action since June indicates potential accumulation if the support holds.
---
🔑 Conclusion
NEIROUSDT is at a critical juncture — waiting for confirmation whether it will bounce from this strong demand zone or break down to continue the bearish trend. Key resistance and support levels are well-defined, providing clear strategies for breakout or rebound traders.
---
📌 Trading Suggestions
Aggressive Longs: Look for bullish signals inside the demand zone (0.00043 – 0.00035)
Conservative Longs: Wait for a breakout above 0.0006198 for trend reversal confirmation
Shorts: Enter if there's a confirmed breakdown below 0.0004337
#NEIROUSDT #CryptoAnalysis #TradingView #AltcoinWatch #SupportResistance #TechnicalAnalysis #BullishSetup #BearishScenario #CryptoTA #ChartUpdate #PriceAction
✅ Get Free Signals! Join Our Telegram Channel Here: t.me/TheCryptoNuclear
✅ Twitter: twitter.com/crypto_nuclear
✅ Join Bybit : partner.bybit.com/b/nuclearvip
✅ Benefits : Lifetime Trading Fee Discount -50%
✅ Twitter: twitter.com/crypto_nuclear
✅ Join Bybit : partner.bybit.com/b/nuclearvip
✅ Benefits : Lifetime Trading Fee Discount -50%
Penafian
Maklumat dan penerbitan adalah tidak dimaksudkan untuk menjadi, dan tidak membentuk, nasihat untuk kewangan, pelaburan, perdagangan dan jenis-jenis lain atau cadangan yang dibekalkan atau disahkan oleh TradingView. Baca dengan lebih lanjut di Terma Penggunaan.