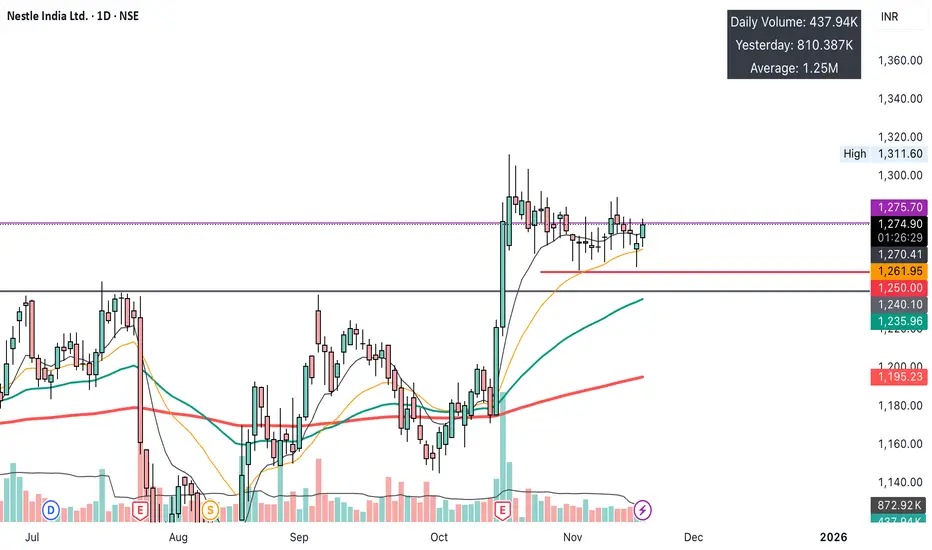
This is a live swing trade I am taking in $NESTLEIND. The stock surged in late October and has since consolidated in a "High Tight Flag," refusing to give back gains. It is now breaking out.
This post details the *full* mechanical framework I am using to manage this trade.
### 1. Indicators Used on This Chart
* **9 EMA (thin black line):** Short-term momentum.
* **21 EMA (thin orange line):** Acts as dynamic support and my trailing stop for the runner.
* **50 EMA (green line):** Medium-term trend.
* **200 EMA (red line):** Long-term uptrend confirmation.
* **Volume:** Confirming the breakout.
### 2. Decoding the Setup
1. **The Pop:** A massive vertical move in late October showed a change in character.
2. **The Flag:** The stock consolidated sideways, "surfing" the **21 EMA**, proving strong demand.
3. **The Breakout:** Today, price is pushing above the `₹1,276.70` resistance.
### 3. The Mechanical Trade Plan (The "Swing" Playbook)
This is a cash "Swing" trade.
* **Bias:** Long
* **Entry:** `₹1,276.70`
* **Stop-Loss (1R):** **`₹1,250.00`** (Placed below the consolidation low and psychological level)
* **Risk:** My risk is fixed at **`₹26.70`** per share (2.09%). Position is sized to my standard 1R.
### 4. Our Exit Strategy (The "2R / 21EMA Hybrid")
1. **Target 1 (Base Hit):** Sell **50% of the position at +2R.**
* **2R Target = ~₹1,330.10**
2. **The "Free Trade" Maneuver:** Once Target 1 is hit, stop-loss on the remaining 50% moves to **Breakeven (`₹1,276.70`).**
3. **Target 2 (The Runner):** I will trail the remaining "free" position using the **21 EMA** to catch the trend.
*Disclaimer: This is not financial advice. This is my personal trade journal and framework, shared for educational and analytical purposes only. Always do your own research.*
Penafian
The information and publications are not meant to be, and do not constitute, financial, investment, trading, or other types of advice or recommendations supplied or endorsed by TradingView. Read more in the Terms of Use.
Penafian
The information and publications are not meant to be, and do not constitute, financial, investment, trading, or other types of advice or recommendations supplied or endorsed by TradingView. Read more in the Terms of Use.