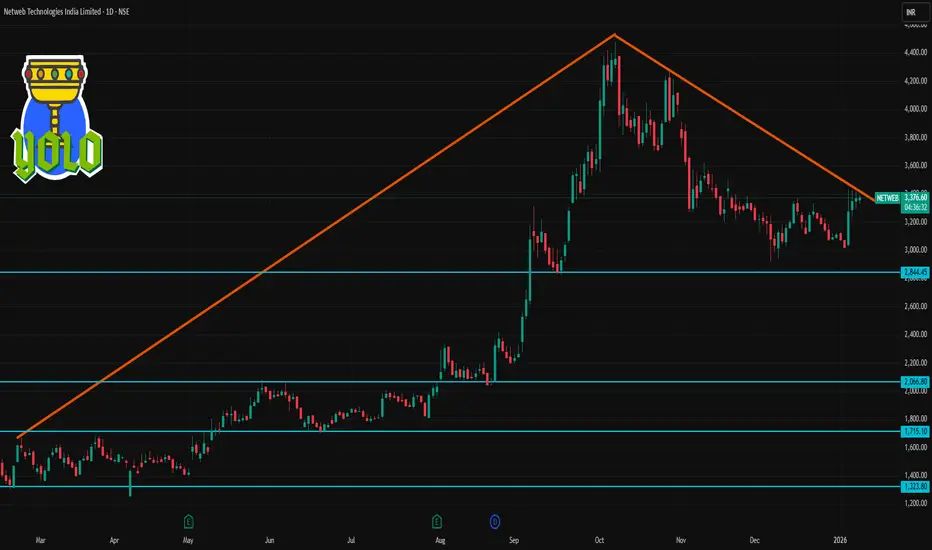
📌 Current Price (Approx)
NETWEB ~ ₹3,347–₹3,368 on NSE (latest market price) — this is the recent traded range as markets open/continue today.
📊 Daily Technical Levels (1-Day Chart)
Pivot Point (Key Reference)
Pivot: ₹3,335–₹3,359 area — central decision zone for bulls vs bears.
🔥 Resistance Levels (Upside)
1. R1: ₹3,436–₹3,437 — first resistance zone.
2. R2: ₹3,525–₹3,526 — next upside hurdle.
3. R3: ₹3,626–₹3,627 — extended breakout target.
📉 Support Levels (Downside)
1. S1: ₹3,246–₹3,247 — immediate support.
2. S2: ₹3,145–₹3,145 — intermediate support line.
3. S3: ₹3,056–₹3,056 — deep support level.
📌 How to Use These Levels Today
Bullish bias: If price stays above pivot (~₹3,350) and breaks R1 ~₹3,436, next targets are R2 and R3.
Bearish bias: If price drops below S1 (~₹3,246), watch S2 and S3 for possible pullbacks/support zones.
📊 Short-Term Technical Mood
Pivot levels suggest an active trading range today — traders often use these references for intraday entry/exit.
RSI/MACD short-term signals are mixed to neutral, indicating a balanced fight between bulls and bears (not strongly overbought nor oversold on daily).
Penerbitan berkaitan
Penafian
Maklumat dan penerbitan adalah tidak bertujuan, dan tidak membentuk, nasihat atau cadangan kewangan, pelaburan, dagangan atau jenis lain yang diberikan atau disahkan oleh TradingView. Baca lebih dalam Terma Penggunaan.
Penerbitan berkaitan
Penafian
Maklumat dan penerbitan adalah tidak bertujuan, dan tidak membentuk, nasihat atau cadangan kewangan, pelaburan, dagangan atau jenis lain yang diberikan atau disahkan oleh TradingView. Baca lebih dalam Terma Penggunaan.