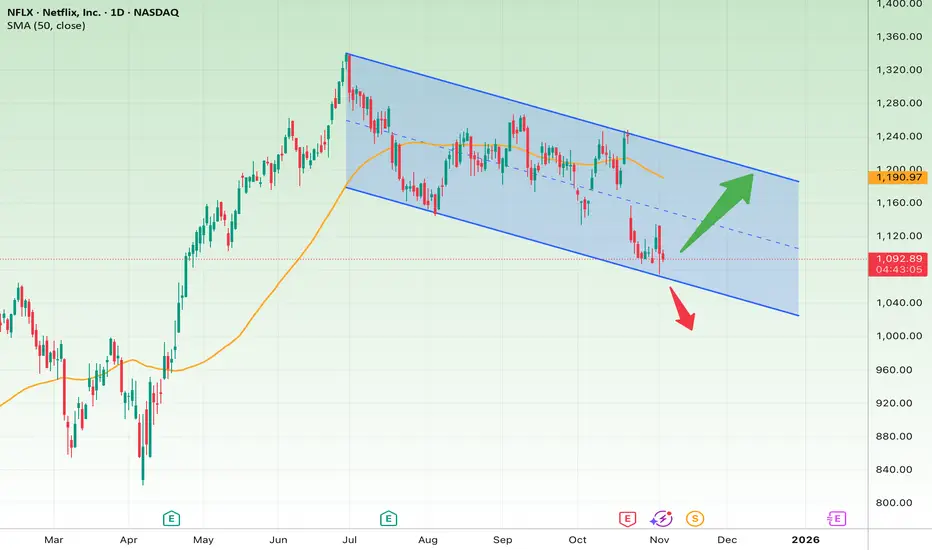
The Netflix (NFLX) daily chart shows a well-defined descending channel that started from around $1,350 and remains intact. The price is currently trading near the lower boundary of the channel ($1,080–$1,100) — a critical zone where buyers may attempt to step in or where a potential bullish divergence could form.
Short-Term Outlook (next few days to weeks):
In the short term, the $1,080 area acts as strong support. If the price manages to hold above this level and bounce back over $1,130, a corrective move toward $1,180–$1,200 is likely — an area that aligns with both the 50-day SMA and the midline of the channel.
However, a confirmed breakdown below $1,080 could trigger further downside toward $1,020 or even the lower channel line near $980.
• Bullish short-term target: $1,180–$1,200
• Bullish stop loss: Below $1,075
• Bearish short-term target: $1,020–$980
• Bearish stop loss: Above $1,130
Long-Term Outlook (1–3 months):
As long as the price remains within the descending channel, the broader trend stays bearish. Yet, the channel is starting to narrow, which often signals a potential end to the correction phase.
A breakout above the upper boundary ($1,220–$1,250) with confirmed closes would signal a trend reversal, opening the way toward $1,350–$1,400.
Conversely, if the lower channel support around $980 breaks down, the next downside target would be $915.
• Bullish long-term target: $1,350–$1,400
• Long-term stop loss: Below $980
In summary, Netflix is sitting at a decisive point within its downtrend channel — holding above $1,080 could spark a short-term rebound, while a breakdown could send the stock below $1,000 toward deeper support levels.
Penafian
Maklumat dan penerbitan adalah tidak bertujuan, dan tidak membentuk, nasihat atau cadangan kewangan, pelaburan, dagangan atau jenis lain yang diberikan atau disahkan oleh TradingView. Baca lebih dalam Terma Penggunaan.
Penafian
Maklumat dan penerbitan adalah tidak bertujuan, dan tidak membentuk, nasihat atau cadangan kewangan, pelaburan, dagangan atau jenis lain yang diberikan atau disahkan oleh TradingView. Baca lebih dalam Terma Penggunaan.