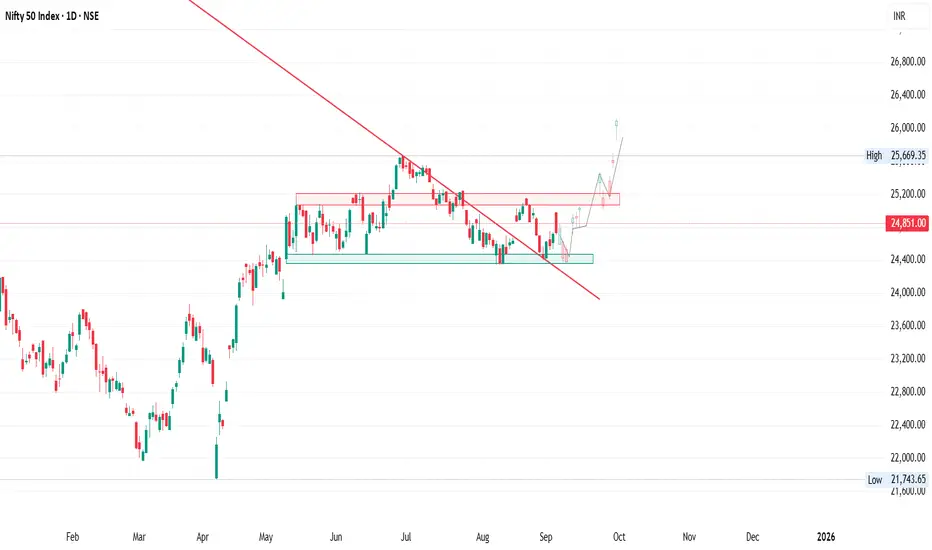
Nifty has already broken out of a downward sloping trendline (marked in red).
Breakout was supported by price bouncing twice from the demand zone
Support Zone:
Strong base identified around 24500(Green box).
This zone has repeatedly acted as demand, preventing deeper correction.
Resistance Zones:
Overhead resistance at 25000–250100 (Red box).
Sustained move above this zone can confirm bullish continuation.
Price Structure:
After breakout, price is retesting its old support.
If this retest holds, Nifty may resume its upward path toward higher targets.
Disclaimer: This is an educational analysis based on price action on the daily chart. Not financial advice. Always use risk management and confirm with your own trading plan.
Penafian
Maklumat dan penerbitan adalah tidak dimaksudkan untuk menjadi, dan tidak membentuk, nasihat untuk kewangan, pelaburan, perdagangan dan jenis-jenis lain atau cadangan yang dibekalkan atau disahkan oleh TradingView. Baca dengan lebih lanjut di Terma Penggunaan.
Penafian
Maklumat dan penerbitan adalah tidak dimaksudkan untuk menjadi, dan tidak membentuk, nasihat untuk kewangan, pelaburan, perdagangan dan jenis-jenis lain atau cadangan yang dibekalkan atau disahkan oleh TradingView. Baca dengan lebih lanjut di Terma Penggunaan.