🔎 Multi-Timeframe Market Structure
4H Chart
Clear rejection from 24,850–24,900 supply zone.
Strong bearish candle printed after touching upper resistance.
Currently sitting around 24,740, right above an FVG + demand pocket (24,680–24,700).
If this zone breaks, next liquidity rests near 24,550–24,580.
👉 Bias: Neutral to bearish unless price reclaims 24,850 convincingly.
1H Chart
Structure shows a lower high at 24,850 and now pushing into corrective leg.
FVG around 24,700–24,740 is being tested right now.
Below this, structural support rests at 24,600 (trendline + OB zone).
👉 Bias: Watching if demand at 24,700 holds. If not, momentum could accelerate down.
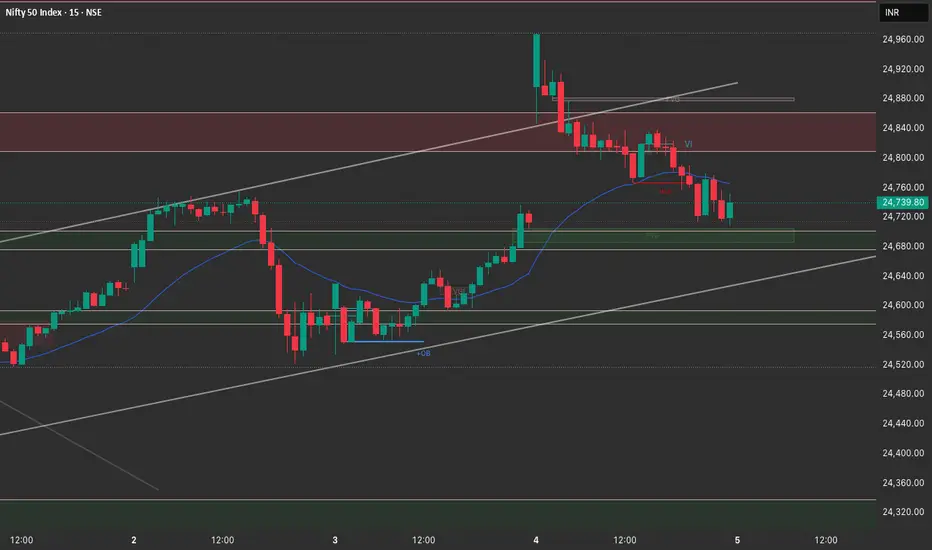
15M Chart
Market created a breaker structure (MSS) at 24,820 → confirms intraday bearishness.
Current candles consolidating around 24,720–24,740 demand.
Liquidity sits below 24,680. If swept, expect sharp reaction (either bounce or further sell-off).
👉 Bias: Short-term consolidation → either bounce back to 24,800 or flush toward 24,600.
🎯 Trade Plan for 5th September
Long Setup
Entry: 24,700–24,720 demand sweep.
Stoploss: Below 24,640.
Targets:
T1: 24,800 (immediate FVG fill)
T2: 24,850–24,880 (supply)
⚠️ Works only if price protects 24,700 demand.
Short Setup
Entry 1: On rejection from 24,800–24,850 zone.
Entry 2: Breakdown below 24,680 demand.
Stoploss: Above 24,880 (for Entry 1) / Above 24,720 (for Entry 2).
Targets:
T1: 24,600 (OB + liquidity)
T2: 24,500 (deeper demand zone)
✅ Key Pivot Levels for 5th Sept
Bullish Protection: 24,700
Bullish Trigger: 24,850
Bearish Trigger: 24,680
Bearish Extension: 24,600 → 24,500
4H Chart
Clear rejection from 24,850–24,900 supply zone.
Strong bearish candle printed after touching upper resistance.
Currently sitting around 24,740, right above an FVG + demand pocket (24,680–24,700).
If this zone breaks, next liquidity rests near 24,550–24,580.
👉 Bias: Neutral to bearish unless price reclaims 24,850 convincingly.
1H Chart
Structure shows a lower high at 24,850 and now pushing into corrective leg.
FVG around 24,700–24,740 is being tested right now.
Below this, structural support rests at 24,600 (trendline + OB zone).
👉 Bias: Watching if demand at 24,700 holds. If not, momentum could accelerate down.
15M Chart
Market created a breaker structure (MSS) at 24,820 → confirms intraday bearishness.
Current candles consolidating around 24,720–24,740 demand.
Liquidity sits below 24,680. If swept, expect sharp reaction (either bounce or further sell-off).
👉 Bias: Short-term consolidation → either bounce back to 24,800 or flush toward 24,600.
🎯 Trade Plan for 5th September
Long Setup
Entry: 24,700–24,720 demand sweep.
Stoploss: Below 24,640.
Targets:
T1: 24,800 (immediate FVG fill)
T2: 24,850–24,880 (supply)
⚠️ Works only if price protects 24,700 demand.
Short Setup
Entry 1: On rejection from 24,800–24,850 zone.
Entry 2: Breakdown below 24,680 demand.
Stoploss: Above 24,880 (for Entry 1) / Above 24,720 (for Entry 2).
Targets:
T1: 24,600 (OB + liquidity)
T2: 24,500 (deeper demand zone)
✅ Key Pivot Levels for 5th Sept
Bullish Protection: 24,700
Bullish Trigger: 24,850
Bearish Trigger: 24,680
Bearish Extension: 24,600 → 24,500
Penafian
Maklumat dan penerbitan adalah tidak bertujuan, dan tidak membentuk, nasihat atau cadangan kewangan, pelaburan, dagangan atau jenis lain yang diberikan atau disahkan oleh TradingView. Baca lebih dalam Terma Penggunaan.
Penafian
Maklumat dan penerbitan adalah tidak bertujuan, dan tidak membentuk, nasihat atau cadangan kewangan, pelaburan, dagangan atau jenis lain yang diberikan atau disahkan oleh TradingView. Baca lebih dalam Terma Penggunaan.