1. Market Structure & Trend Overview
1D Chart (Higher Timeframe Bias)
Bearish Market Structure: The market has been in a downtrend, breaking market structure (MSS) at key levels. The recent rally from March was a retracement into a premium zone.
Key Resistance Areas:
Order Block (OB) at ~23,600: Market is rejecting this supply zone.
Previous Daily High (PDH) & Premium Liquidity Zone: Price recently swept liquidity above PDH and is rejecting.
Key Support Areas:
Fair Value Gap (FVG) at 22,800-22,900: This is the next area where price may drop to seek liquidity.
PDL (Previous Daily Low): A liquidity pool where price may react.
📌 Prediction:
If price stays below 23,600, the market may seek liquidity at 23,000 or even 22,800.
If price reclaims 23,600, a move towards 24,000 is possible.
4H Chart (Mid-Timeframe Confirmation)
Bearish Market Structure: Price is forming lower highs and recently had a Change of Character (ChoCH) to the downside.
Key Levels to Watch:
23,600 OB & FVG: Market is rejecting this area.
23,200-23,250 (Liquidity Area): Price is building liquidity below.
22,900 (FVG & Key Support): If price breaks down, this will be a magnet.
Strong Resistance at 23,600: If price gets here, it could be a sell opportunity.
📌 Prediction:
A potential short trade if price retraces back to 23,500-23,600 (OB) with targets at 23,200 & 22,900.
If 23,200 holds, a bounce to 23,500 is possible.
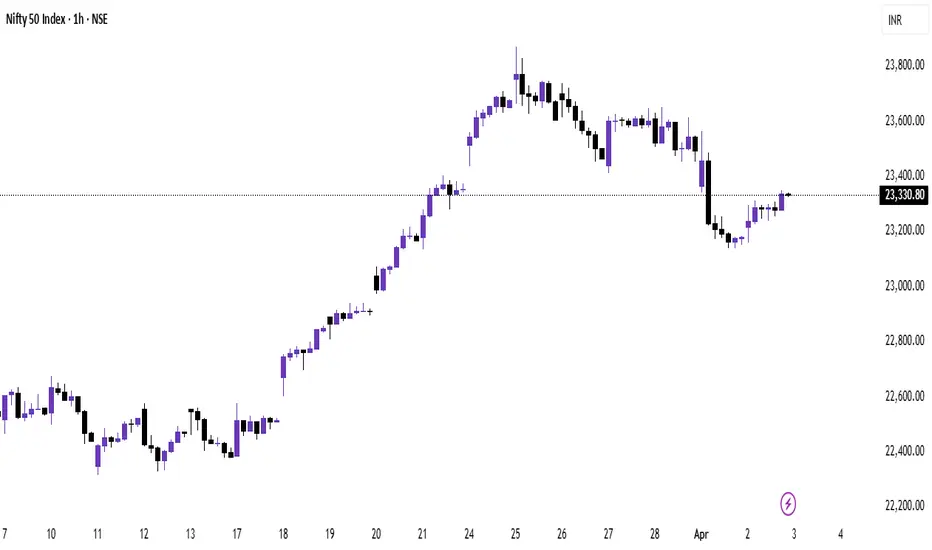
1H Chart (Execution Level)
Price Action Observations:
Liquidity Sweep at PDH: Market took out buy-side liquidity and is now retracing.
FVG Below 23,200: This is a draw on liquidity.
PWL (Previous Week’s Low) at 23,150-23,200: This could act as support before further downside.
📌 Trade Idea (Bearish Setup)
Entry: Sell near 23,500-23,600 (OB & FVG Zone).
Stop Loss: Above 23,650 (Above liquidity zone).
Take Profit Targets:
TP1: 23,200 (First liquidity pool).
TP2: 22,900 (FVG fill & support area).
🔹 Alternative Bullish Scenario: If price does not break 23,200 and forms bullish structure, a long towards 23,600 can be considered.
1D Chart (Higher Timeframe Bias)
Bearish Market Structure: The market has been in a downtrend, breaking market structure (MSS) at key levels. The recent rally from March was a retracement into a premium zone.
Key Resistance Areas:
Order Block (OB) at ~23,600: Market is rejecting this supply zone.
Previous Daily High (PDH) & Premium Liquidity Zone: Price recently swept liquidity above PDH and is rejecting.
Key Support Areas:
Fair Value Gap (FVG) at 22,800-22,900: This is the next area where price may drop to seek liquidity.
PDL (Previous Daily Low): A liquidity pool where price may react.
📌 Prediction:
If price stays below 23,600, the market may seek liquidity at 23,000 or even 22,800.
If price reclaims 23,600, a move towards 24,000 is possible.
4H Chart (Mid-Timeframe Confirmation)
Bearish Market Structure: Price is forming lower highs and recently had a Change of Character (ChoCH) to the downside.
Key Levels to Watch:
23,600 OB & FVG: Market is rejecting this area.
23,200-23,250 (Liquidity Area): Price is building liquidity below.
22,900 (FVG & Key Support): If price breaks down, this will be a magnet.
Strong Resistance at 23,600: If price gets here, it could be a sell opportunity.
📌 Prediction:
A potential short trade if price retraces back to 23,500-23,600 (OB) with targets at 23,200 & 22,900.
If 23,200 holds, a bounce to 23,500 is possible.
1H Chart (Execution Level)
Price Action Observations:
Liquidity Sweep at PDH: Market took out buy-side liquidity and is now retracing.
FVG Below 23,200: This is a draw on liquidity.
PWL (Previous Week’s Low) at 23,150-23,200: This could act as support before further downside.
📌 Trade Idea (Bearish Setup)
Entry: Sell near 23,500-23,600 (OB & FVG Zone).
Stop Loss: Above 23,650 (Above liquidity zone).
Take Profit Targets:
TP1: 23,200 (First liquidity pool).
TP2: 22,900 (FVG fill & support area).
🔹 Alternative Bullish Scenario: If price does not break 23,200 and forms bullish structure, a long towards 23,600 can be considered.
Penerbitan berkaitan
Penafian
Maklumat dan penerbitan adalah tidak dimaksudkan untuk menjadi, dan tidak membentuk, nasihat untuk kewangan, pelaburan, perdagangan dan jenis-jenis lain atau cadangan yang dibekalkan atau disahkan oleh TradingView. Baca dengan lebih lanjut di Terma Penggunaan.
Penerbitan berkaitan
Penafian
Maklumat dan penerbitan adalah tidak dimaksudkan untuk menjadi, dan tidak membentuk, nasihat untuk kewangan, pelaburan, perdagangan dan jenis-jenis lain atau cadangan yang dibekalkan atau disahkan oleh TradingView. Baca dengan lebih lanjut di Terma Penggunaan.