4-Hour Chart:
Trend Context: Nifty has been in a strong uptrend, forming a rising channel. It has now reached a significant overhead supply zone, indicated by price action on Sep 17th.
Key Resistance: The red zone at 25,330 - 25,400 is a crucial area of overhead supply. The close on Sep 17th was at 25,330.05, right at the edge of this zone.
Key Support: The green support zone around 24,900 - 24,950 was a significant pivot. The ascending channel's lower trendline and the subsequent higher low formation around 25,000 - 25,100 have also served as support.
Observation: Nifty has closed precisely at the upper boundary of the rising channel and at the lower edge of the significant supply zone (25,330 - 25,400). This indicates a potential turning point. The price action on Sep 17th shows indecision with a long wick at the top, suggesting sellers are active in this zone.
1-Hour Chart:
Intraday Structure: The 1-hour chart shows a bullish trend with higher highs and higher lows within the ascending channel. However, the momentum appears to be slowing as it approaches the 25,330 - 25,400 supply. The closing candle on Sep 17th has a long upper wick, indicating rejection from higher prices.
EMA (21): The EMA (21) is around 25,170, currently acting as intraday support. Price closed above it, but the proximity to the resistance zone makes it a critical level to watch.
Fair Value Gap (FVG): A notable FVG exists between 25,100 - 25,200. This area was used as a pivot and demand zone during the recent rally. A break below this could signal further weakness.
Break of Structure (BOS): The chart indicates a BOS on the upside around 25,180, confirming the upward momentum. However, the recent price action at the resistance suggests this momentum might be stalling.
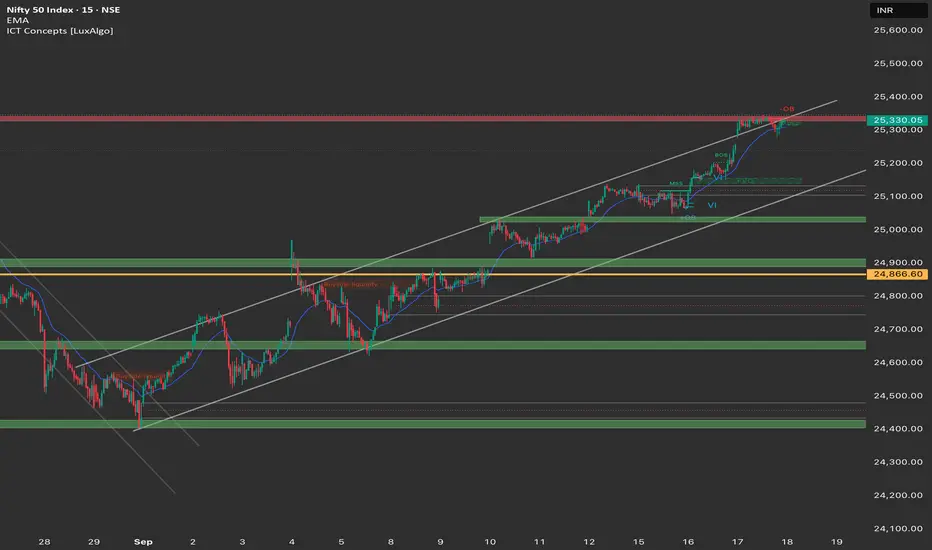
15-Minute Chart:
Micro-Structure: The 15-minute chart reveals that price attempted to break above 25,330 but was met with strong selling pressure, leading to a liquidity grab above the resistance before pulling back. This resulted in a confirmed Break of Structure (BOS) downwards on this timeframe around 25,240.
Consolidation: Price is currently consolidating just below the 25,240 level, which is now acting as immediate resistance. The support level to watch is around 25,100-25,120 (where the FVG and previous BOS occurred).
Short-Term Bias: The failure to sustain price above 25,330 and the subsequent BOS on the 15M chart indicate short-term weakness. Buyers are defending the area around 25,100-25,120.
Summary of Key Dynamics for September 18th:
Nifty is at a critical juncture, exactly at the confluence of the upper boundary of its rising channel and a significant supply zone (25,330 - 25,400). The closing candle on Sep 17th shows rejection. The 15-minute chart confirms a short-term BOS downwards after a liquidity grab, indicating potential downside. The key levels to watch are 25,330 for resistance and 25,100-25,120 for support.
📝 Trade Plan - Nifty 50 (18th September 2025)
Long Scenario (Cautious):
Entry Zone: 25,100 - 25,150 (retest of the previous BOS/FVG zone, if it holds as support)
Targets:
T1: 25,240 (immediate resistance on 15M)
T2: 25,300 (psychological level)
T3: 25,330 - 25,400 (major supply zone - look for signs of reversal or a strong breakout)
Stop Loss: Below 25,050 (below the recent swing low and the FVG area)
Short Scenario (Preferred Bias):
Trigger: A confirmed break and sustained close below 25,100 on the 15M/1H chart.
Entry Zone: 25,120 - 25,150 (retest of the broken support/FVG zone as resistance)
Targets:
T1: 25,000 (psychological support)
T2: 24,900 - 24,950 (major demand zone)
T3: 24,800 (lower support if major demand fails)
Stop Loss: Above 25,200 (above the recent swing high and the FVG fill area)
Summary for September 18th:
Below 25,330: Look for shorts with targets towards 25,100 and then 24,900 - 24,950.
Above 25,330: If Nifty can decisively break and hold above 25,330, longs could be considered, but with extreme caution and tight stops, targeting 25,400 and then looking for signs of exhaustion.
Expect volatility around the open. It is best to wait for the 15M structure confirmation after the market opens to gauge the true direction, especially given the confluence of resistance and channel boundary.
Trend Context: Nifty has been in a strong uptrend, forming a rising channel. It has now reached a significant overhead supply zone, indicated by price action on Sep 17th.
Key Resistance: The red zone at 25,330 - 25,400 is a crucial area of overhead supply. The close on Sep 17th was at 25,330.05, right at the edge of this zone.
Key Support: The green support zone around 24,900 - 24,950 was a significant pivot. The ascending channel's lower trendline and the subsequent higher low formation around 25,000 - 25,100 have also served as support.
Observation: Nifty has closed precisely at the upper boundary of the rising channel and at the lower edge of the significant supply zone (25,330 - 25,400). This indicates a potential turning point. The price action on Sep 17th shows indecision with a long wick at the top, suggesting sellers are active in this zone.
1-Hour Chart:
Intraday Structure: The 1-hour chart shows a bullish trend with higher highs and higher lows within the ascending channel. However, the momentum appears to be slowing as it approaches the 25,330 - 25,400 supply. The closing candle on Sep 17th has a long upper wick, indicating rejection from higher prices.
EMA (21): The EMA (21) is around 25,170, currently acting as intraday support. Price closed above it, but the proximity to the resistance zone makes it a critical level to watch.
Fair Value Gap (FVG): A notable FVG exists between 25,100 - 25,200. This area was used as a pivot and demand zone during the recent rally. A break below this could signal further weakness.
Break of Structure (BOS): The chart indicates a BOS on the upside around 25,180, confirming the upward momentum. However, the recent price action at the resistance suggests this momentum might be stalling.
15-Minute Chart:
Micro-Structure: The 15-minute chart reveals that price attempted to break above 25,330 but was met with strong selling pressure, leading to a liquidity grab above the resistance before pulling back. This resulted in a confirmed Break of Structure (BOS) downwards on this timeframe around 25,240.
Consolidation: Price is currently consolidating just below the 25,240 level, which is now acting as immediate resistance. The support level to watch is around 25,100-25,120 (where the FVG and previous BOS occurred).
Short-Term Bias: The failure to sustain price above 25,330 and the subsequent BOS on the 15M chart indicate short-term weakness. Buyers are defending the area around 25,100-25,120.
Summary of Key Dynamics for September 18th:
Nifty is at a critical juncture, exactly at the confluence of the upper boundary of its rising channel and a significant supply zone (25,330 - 25,400). The closing candle on Sep 17th shows rejection. The 15-minute chart confirms a short-term BOS downwards after a liquidity grab, indicating potential downside. The key levels to watch are 25,330 for resistance and 25,100-25,120 for support.
📝 Trade Plan - Nifty 50 (18th September 2025)
Long Scenario (Cautious):
Entry Zone: 25,100 - 25,150 (retest of the previous BOS/FVG zone, if it holds as support)
Targets:
T1: 25,240 (immediate resistance on 15M)
T2: 25,300 (psychological level)
T3: 25,330 - 25,400 (major supply zone - look for signs of reversal or a strong breakout)
Stop Loss: Below 25,050 (below the recent swing low and the FVG area)
Short Scenario (Preferred Bias):
Trigger: A confirmed break and sustained close below 25,100 on the 15M/1H chart.
Entry Zone: 25,120 - 25,150 (retest of the broken support/FVG zone as resistance)
Targets:
T1: 25,000 (psychological support)
T2: 24,900 - 24,950 (major demand zone)
T3: 24,800 (lower support if major demand fails)
Stop Loss: Above 25,200 (above the recent swing high and the FVG fill area)
Summary for September 18th:
Below 25,330: Look for shorts with targets towards 25,100 and then 24,900 - 24,950.
Above 25,330: If Nifty can decisively break and hold above 25,330, longs could be considered, but with extreme caution and tight stops, targeting 25,400 and then looking for signs of exhaustion.
Expect volatility around the open. It is best to wait for the 15M structure confirmation after the market opens to gauge the true direction, especially given the confluence of resistance and channel boundary.
Penafian
Maklumat dan penerbitan adalah tidak bertujuan, dan tidak membentuk, nasihat atau cadangan kewangan, pelaburan, dagangan atau jenis lain yang diberikan atau disahkan oleh TradingView. Baca lebih dalam Terma Penggunaan.
Penafian
Maklumat dan penerbitan adalah tidak bertujuan, dan tidak membentuk, nasihat atau cadangan kewangan, pelaburan, dagangan atau jenis lain yang diberikan atau disahkan oleh TradingView. Baca lebih dalam Terma Penggunaan.