Friends I have made an visual representation of where the Nifty would be heading based on the
Method i follow as wave theory
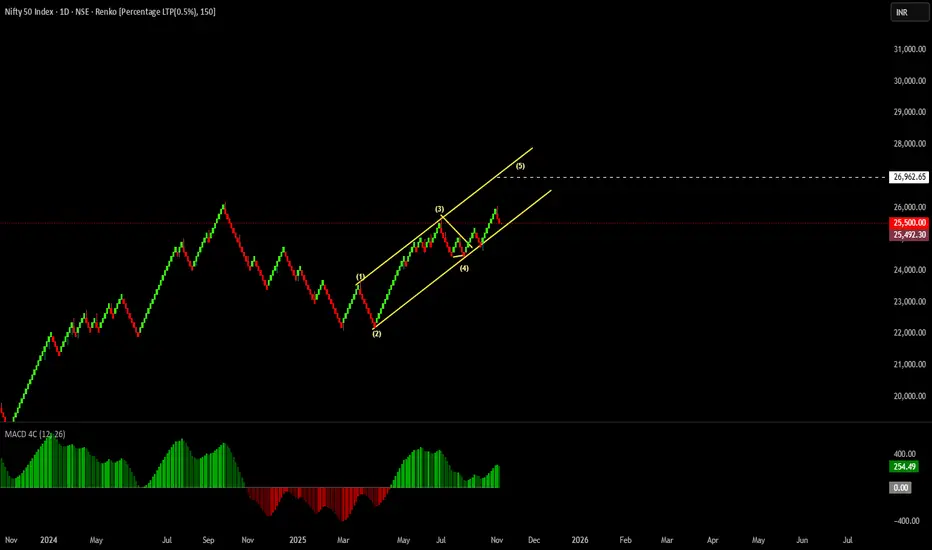
Interesting to note the price is in the channel or representation of channel fits the price movement
Also You can note i have selected 0.50 % Box size in Ranko Bars , which represents the movement in harmonic or linear movements based on fixed price bars
Now i have applied wave theory which represents the methods i follow as Analyst
Wave 2 Represents sharp correction
Wave 4 Represents Complex Running Flat Pattern leaving second leg correction fell short to represent the urgency in the Movement
Now I have forecasted it with mathematical calculations which may represents an measured move method to take Profits
All this is an education content
I hope you understand it and then hit the like button
Good luck
Method i follow as wave theory
Interesting to note the price is in the channel or representation of channel fits the price movement
Also You can note i have selected 0.50 % Box size in Ranko Bars , which represents the movement in harmonic or linear movements based on fixed price bars
Now i have applied wave theory which represents the methods i follow as Analyst
Wave 2 Represents sharp correction
Wave 4 Represents Complex Running Flat Pattern leaving second leg correction fell short to represent the urgency in the Movement
Now I have forecasted it with mathematical calculations which may represents an measured move method to take Profits
All this is an education content
I hope you understand it and then hit the like button
Good luck
Dagangan aktif
I did try to tell you that Majority of Market participents are looking for New highs , all you can do now is trail the stop on your holding in Nifty , Enjoy the ride Penafian
Maklumat dan penerbitan adalah tidak bertujuan, dan tidak membentuk, nasihat atau cadangan kewangan, pelaburan, dagangan atau jenis lain yang diberikan atau disahkan oleh TradingView. Baca lebih dalam Terma Penggunaan.
Penafian
Maklumat dan penerbitan adalah tidak bertujuan, dan tidak membentuk, nasihat atau cadangan kewangan, pelaburan, dagangan atau jenis lain yang diberikan atau disahkan oleh TradingView. Baca lebih dalam Terma Penggunaan.